How to Screen
With a well-constructed screen, you can quickly shortlist stocks that meet your objectives, saving time and energy.
Stock Screening Defined
Stock screening is the process of applying numerical criteria to a broad universe of stocks. It allows you to narrow the universe to only a few stocks that meet your objectives.
The Purpose of Screening
Screening for stocks is one of many ways to discover new investment ideas. Most traders, investors and analysts only have the time to research a few companies a week. Financial media features thousands of companies daily, making it challenging to filter the information and decide which companies to focus on. Stock screening saves you research time by allowing you to eliminate names that do not meet your objectives. While stock screening is highly beneficial, there are no magical screens. It is essential to understand that while screening is a great way to start looking for stock picks, further research should be done before making an investment decision.
The Process
Stock screening is a multistage process, and it is crucial to spend time carefully analyzing each stage. A well-constructed screen helps shortlist stocks meeting your primary objectives, saving you time and energy in the research process. The steps in the screening process are as follows:
- Defining Your Objective
- Constructing Criteria
- Reporting and Picking Stocks to Research
Defining Your Objective
Before using the stock screener, you must identify what types of stocks you are looking for. Your investment objective should include the characteristics of your ideal stock and consider your performance goals, risk tolerance, and investment philosophy. The common broad objectives include targeting growth, value, or momentum stocks. The Zacks Premium Screens section offers several predefined screens strategically created on such objectives. For investors desiring a more precise objective, the Zacks Custom Stock Screener is one of the best online screeners. It allows you to implement a focused, narrowly defined objective.
Suggestion:
Stop and write down your objective on a piece of paper. It may be useful to come up with a list of the characteristics of your ideal stock.
Constructing Criteria
While it is often easy to come up with meaningful screening parameters, combining them to produce an effective screen can be challenging. You must first come up with criteria based on your objective and then evaluate the criteria to ensure they are not contradictory.
The most important screening criteria should evolve naturally from your objective. These criteria should attempt to filter out companies that do not meet your objective. Screening criteria filter out stocks by comparing a company
Some criteria should only be used on a relative basis. Ratios such as margins and turnover are industry-specific and become meaningful only when compared to industry norms or company trends. A company with a 10% profit margin in the retail industry may be considered one of the most efficient businesses in the industry. In comparison, a company with a 10% profit margin in the software industry will likely struggle relative to its competition.
On the other hand, you can choose to compare a company
Suggestion:
Pick the most important 1-4 items from your objective and translate them into basic criteria. If you are interested in performing more detailed screens (including more screening items and more advanced relative criteria), contact Zacks for information on the Research Wizard screening software.
Even if you succeed in defining a focused objective and translating it into basic criteria, you can still expect some companies that don
It
Reporting and Detailed Research
Finally, you must decide which items to include in your report. The reports from the Zacks Stock Screener are in table format and fully customizable. After you are finished with the report, you can use the stock research pages on the Zacks website to research fundamental company information, detailed analyst estimates, insider trading data, detailed company descriptions, and much more!
Suggestion:
In addition to the most important screening items, your report should contain items you may find important when making an investment decision. Select stocks from the report that look attractive based on the numbers, and see detailed research on them on Zacks.com.
Keep in mind that there are no magical screens that turn out guaranteed winners. The purpose of an effective screen is to provide you with a preliminary list of potential winners.
Remember to:
- Develop a focused, narrowly defined objective.
- Construct criteria to meet your objective.
- Do an in-depth company analysis, considering both qualitative and quantitative factors, before making an investment decision.
Backtesting
With backtesting, you can see how successful your stock-picking strategy has been and might be.
Once you
The performance of your stock-picking strategy in the past can help you predict its success today and in the future. Of course, past performance is no guarantee of future results, but what else do you have to go by?
Think about it; if you saw that a stock picking strategy did nothing but lose money, year after year, period after period, stock after stock, over and over again (you get the point), there
Why? Because it
Sure, it may turn around and start picking winners, but it may also continue to pick losing stocks the way it always has.
On the other hand...
What if you saw a strategy that did great year after year, period after period (you know where this is headed), you
Why? Because it
And while it may start picking losers all of a sudden, it most likely will continue to pick winning stocks, just like it had been doing consistently in the past.
Keep in mind, a screening and backtesting program isn
But its a great way to see what works and what doesnt BEFORE you put your money at risk!
Don
But if your strategy picks winners far more often than losers, then once you find yourself in a losing trade, you can quickly cut your losses and feel confident that your next pick will have a high probability of success.
And if your strategy has proven to do well in both up and down markets, you
And that
Research Wizard
Zacks offers a premium tool to backtest your screens called the Research Wizard. You can create your own winning strategies or use the ones we
Screening with P/E
Screening with the P/E ratio can help investors identify excellent opportunities.
The price-to-earnings ratio, more commonly referred to as a P/E ratio, is one of the most important and popular criteria that investors use to determine a stock
Criteria Defined
The P/E ratio measures a company
How to Use
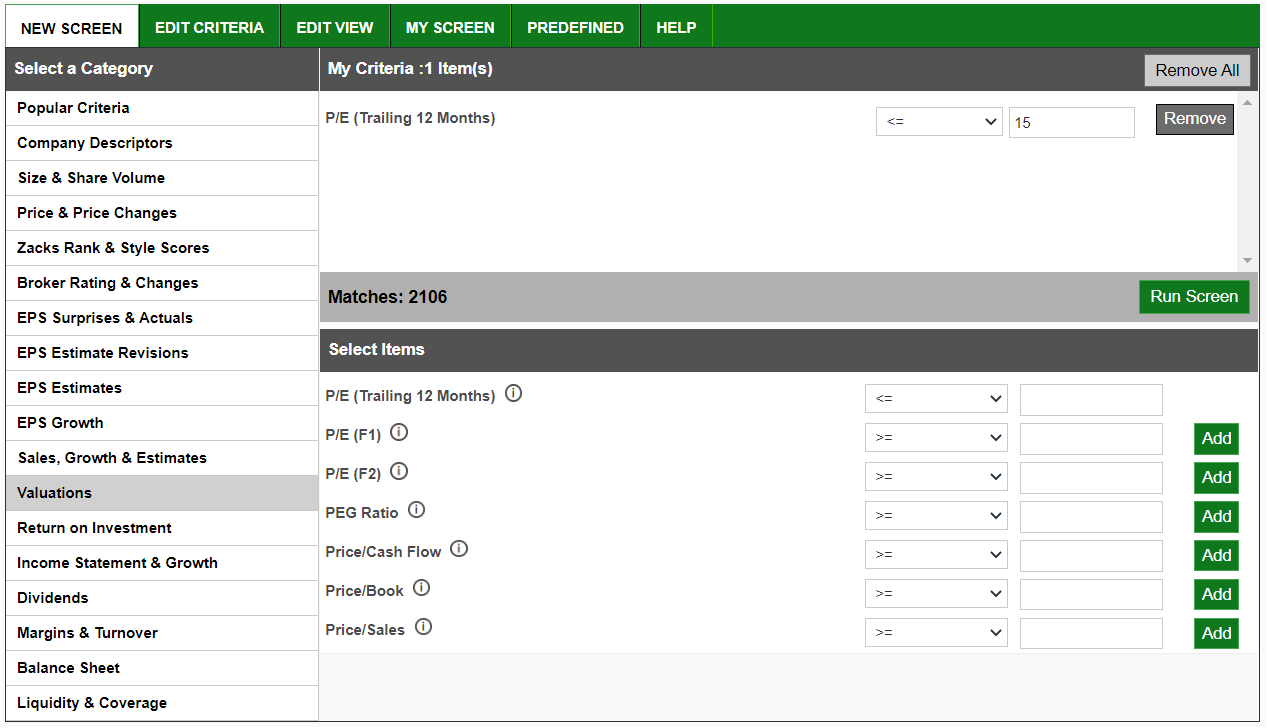
Zacks Custom Screener, which is totally free, carries P/E filters that enable an investor to establish limits for P/E multiples. In the screenshot below, you can see that I have set a P/E parameter of less than or equal to 15, which means I only want my screen to show me stocks that carry a trailing-12-month P/E reading of 15 or lower. This is a straightforward and effective way to identify stocks with the desired valuations.
Improving Your Screening Results
Comparing a company
When comparing P/E ratios, the S&P 500 Index is frequently used as a benchmark. A stock trading at a 12X P/E, compared to the S&P 500
On the other side of that paradigm would be a stock with a P/E ratio of 20X. The conclusion in this instance is that this stock is trading at a premium to the market and may be overvalued based on historical earnings.
Below is a screenshot of the Research Wizard category covering the P/E metric. As you can see, several types and classifications can be used in this application to filter for desired P/E multiples.
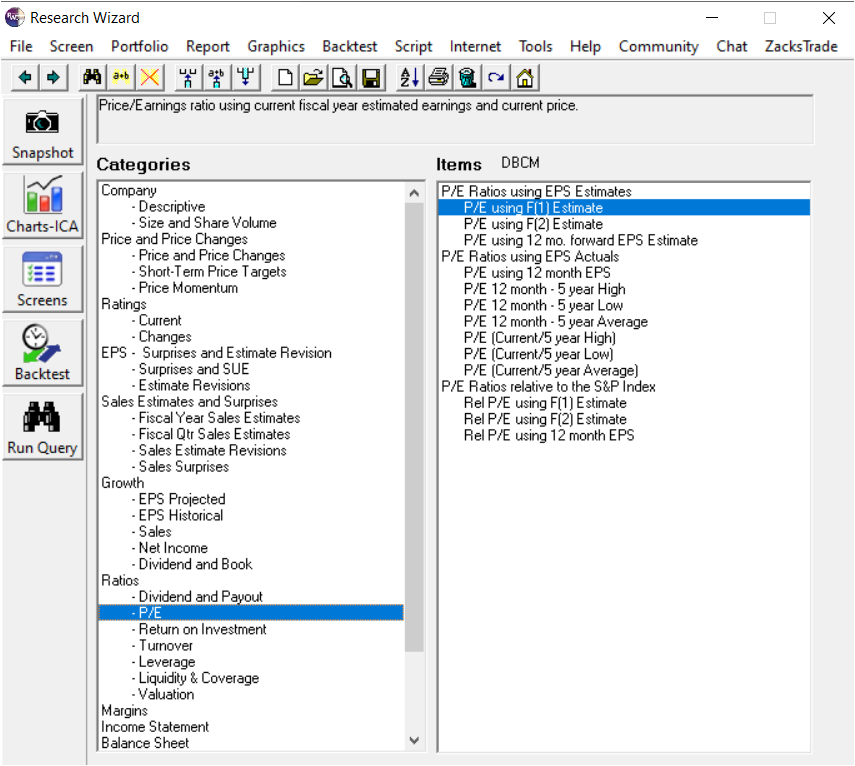
The Zacks Research Wizard enables investors to drill deeper into the P/E ratio to gain valuable insights and information that can lead to long-term, sustainable results.
Conclusion
The P/E ratio is a straightforward yet powerful metric. It indicates how much investors are willing to pay for each dollar of the company
Screening for Earnings Estimates Revisions
Investors can identify stocks with near-term upside potential by screening for earnings estimate revisions.
Earnings estimate revisions are at the heart of the Zacks trading/investment philosophy, stating that stocks that have recently had their estimates revised upward by analysts tend to outperform the market over the next 9-12 months.
Criteria Defined
Earnings estimates, provided by brokerage analysts, are widely used to gauge a company
How To Use
The Zacks Custom Screener, a free screening tool, enables the user to screen for companies that have recently had their earnings estimates revised upward by the analyst community. By searching for these companies, investors can align themselves with stocks that are best positioned to outperform the market and produce exceptional portfolio returns.
Improving Your Screening Results
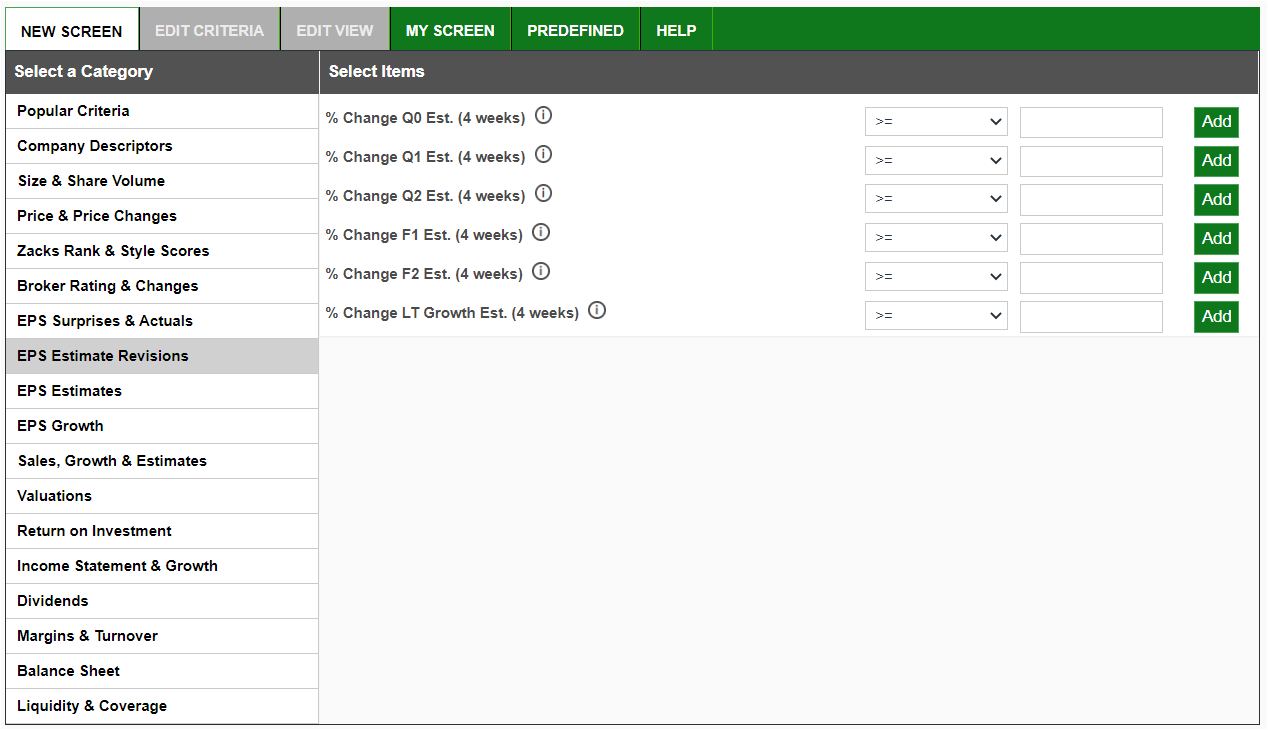
In order to refine your approach to screening with earnings estimates and dig even deeper into this data set, we recommend using the Zacks Research Wizard, which offers functionalities beyond the Custom Screener. As you can see from the screenshot below, the Research Wizard contains numerous categories for analyzing trends in earnings estimates, enabling investors to gain additional insight.
Conclusion
You can use these tools to find stocks with rising earnings estimates and increase your odds of success with their potential upside.
Screening for Momentum
Momentum screening can be used to identify stocks that are trending upward.
Momentum investing is a trading strategy that aligns investors with securities reacting to information and helps them benefit from the prevailing trends. Unusual actual earnings or earnings expectations for a company often drives momentum in its stock. There could be plenty of other information that can create momentum in a stock.
Criteria Defined
Some momentum investors like to see upgrades to earnings estimates, while others may want to focus on stocks hitting new 52-week highs. The specifics of the style are indeed left to the investor to customize. Either way, there is a long list of criteria that momentum investors can draw from to create their own highly personalized style.
How to Use
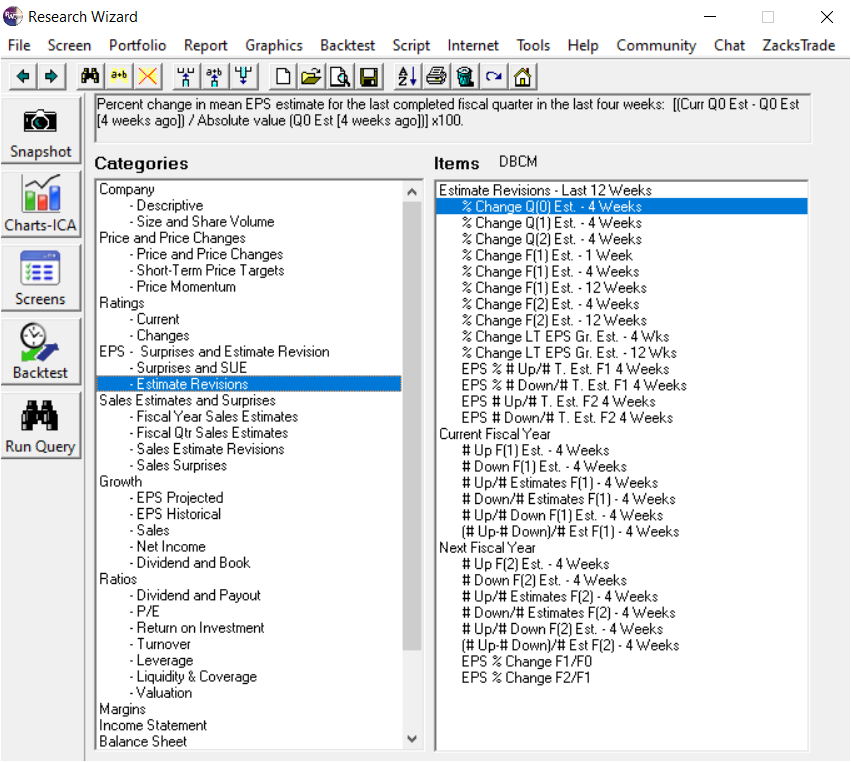
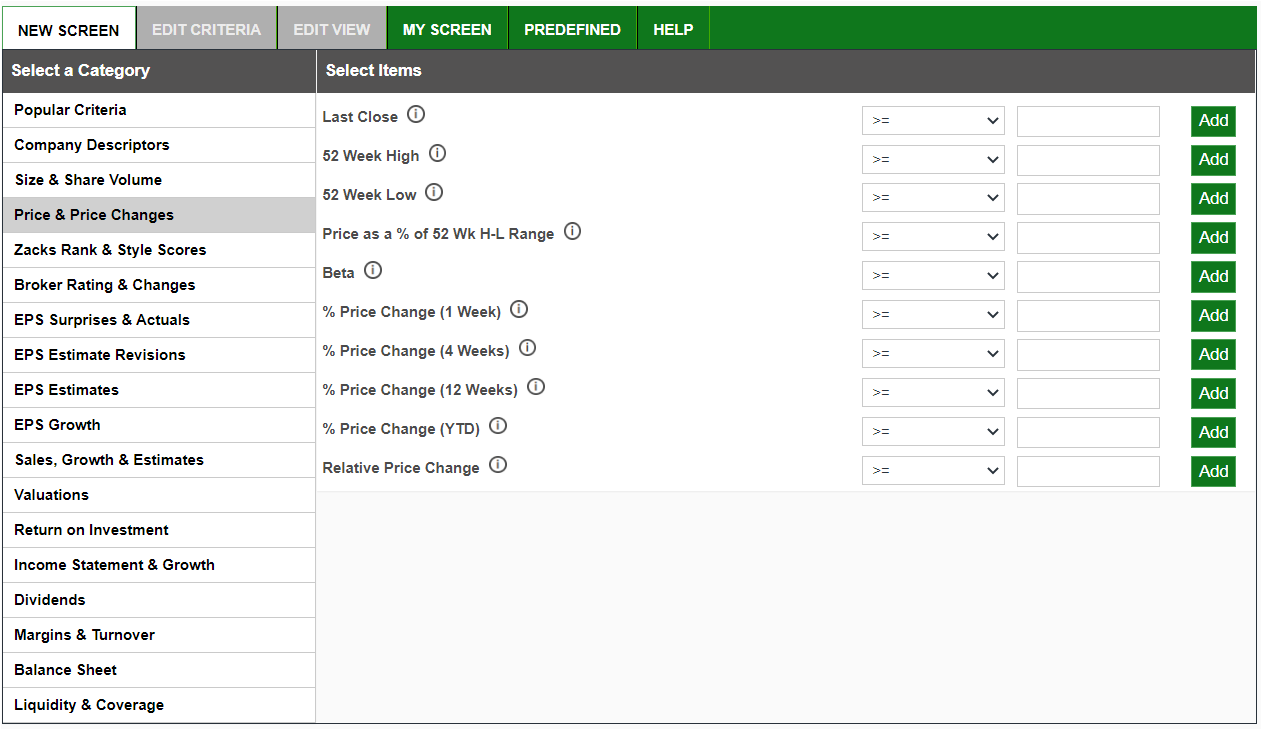
Momentum criteria should be used to narrow down a list of stocks for further, more detailed examination. Along with upward earnings estimate revisions and new 52-week highs, many other momentum criteria can be found in the Zacks Custom Screener section under both the fundamental and technical categories. This tool enables users to enter their specific momentum criteria. As you can see in the screenshot below, it contains several momentum parameters under categories, such as Price & Price Changes and EPS Estimate Revisions:
Improving Your Momentum Screening Results
While the Custom Screener has plenty of functionalities that can assist investors in identifying winning stocks, the Zacks Research Wizard has many advanced features that can help refine the strategy. Most importantly, the Research Wizard enables investors to backtest any screen to see how it would have performed in different market environments in the past.
Among the advanced features, the Research Wizard helps identify high-growth industries and then apply momentum criteria to identify the most attractive stocks. This powerful tool helps screen stocks possessing the right combination of fundamentals and technicals.
Conclusion
While creating momentum investment strategies, Zacks tools enable investors to mine through millions of data sets to identify stocks that meet their objectives.