This is an excerpt from our most recent Economic Outlook report. To access the full PDF, please click here.
A solo September 2021 fact — all-time record home prices — seems almost impossible.
But here we are. Dealing with another huge run-up in single-family U.S. home prices.
Remember that huge 2006-2009 price bust? Of course, you do. It took Wall Street and the entire U.S. economy down with it.
- In Q1-2009, the median price of a U.S. home bottomed at $208,400.
- In Q3-2017, nearly long nine years of price recovery reached a plateau at $320,500. The Compound Annual Growth Rate in single family home prices, across those 8.5 years, is +7.3%.
- Across the next 3 years, from 2017 to 2020, that CAGR fell to +3.9%.
Even after that years-long ascent, the median price of homes sold in the USA rose +16.2% percent in one year from $322,600 Q2-20 to $374,900 in Q2-21 — to a new record, according to the Federal Reserve’s data.
That big a one-year run-up raises a key macro question: Why did U.S. home prices rise so fast over the last year?
In this narrative I unfurl: the first 3 macro factors — home supply and demand — mattered most.
The 4th macro factor, a fall in 30-year fixed home mortgage rates, mattered least.
That forced macro ranking, in and of itself, is important to understand. It implies current Federal Reserve policy towards mortgage rates may be overstated as a clean, one-step, direct driving factor.
If this steep home price ascent is indeed a Fed policy bubble, how it was caused is a more complex story.
Let me show you a salient timeline of U.S. macro facts to make my case:
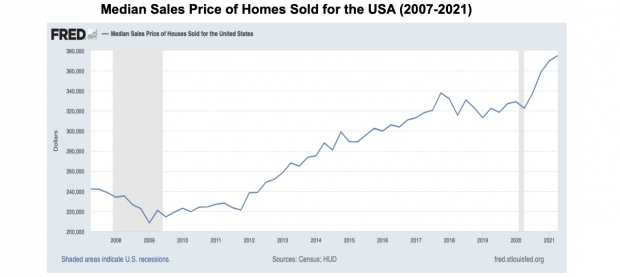
Image Source: Federal Reserve Bank of St Louis
This housing price surge phenomenon — to a new record — bears a deeper dive.
In this economist’s thinking, there are four major fundamental macro factors:
1. U.S. Home Inventory for Sale Collapsed
When the wave of public health-driven COVID shutdown orders hit the USA, in March of 2020, there was little choice. People stayed in their homes, and did not sell them.
What else could they do?
By October of 2020, the Monthly Supply of Houses in the USA fell to 3.5 months. Going back to 1963, that number (3.5) was only hit one other time, from June to August of 2003.
How does this compare, during this more recent, over decade-long cycle?
- In 2009, the Monthly Supply peaked at 12 month’s supply
- In 2010, it had fallen to 8 months
- Looking from 2012 to 2020 this number typically toggled around 5.0 month’s supply
In July 2021, the Monthly Supply in the USA shot up to 6.2.
In Sept. 2021, unique U.S. home market COVID shutdown circumstances are likely over. Much like the jobs market, after the vaccination-driven opening, sales offerings of homes shot up.
Consult the FRED chart below on all of this:
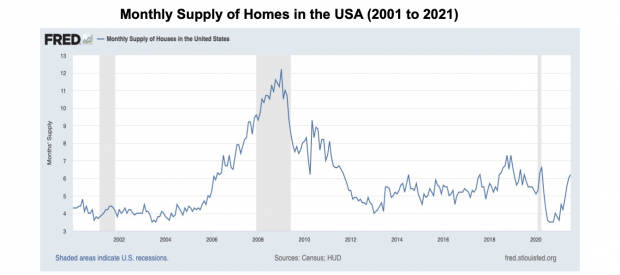
Image Source: Federal Reserve Bank of St Louis
2. Home Builders Got Shut-In
Looking across the last 50 years of available FRED new privately-owned housing units data shows you something of a base case for thinking.
Generally, the U.S. annual private home starts average is 1.6M, with 1.2M as the bottom of the range and 2.0M as the top of the range.
Shutdown orders did apply to construction firms. So, in April 2020, that number fell to just 938K.
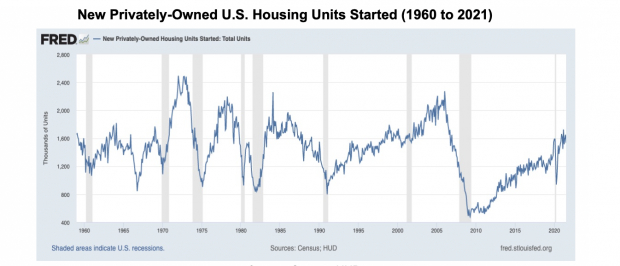
Image Source: Census, HUD
The latest June and July numbers for the USA starts is back to that 1.6 million number.
Again, don’t get fooled.
In the fall of 2021, the unique U.S. starts — fresh building supply — circumstance is likely over, too.
3. Pent-Up Millennial Buyer Demand Surged
When needing to think about U.S. generation cohorts, and their housing demand, Pew Research is a good starting point.
Pew Research conveniently put together the following table in February 2019—
Silent Generation:
Born: 1928 to 1945
Age in 2018: 73 to 90
Baby Boomer:
Born: 1946 to 1964
Age in 2018: 54 to 72
Generation X:
Born 1965 to 1980
Age in 2018: 38 to 53
Millennial:
Born: 1981 to 1996
Age in 2018: 22 to 37
Generation Z:
Born: 1997 to 2012
Age in 2018: 6 to 21
First, entering COVID, the Millennial generation of 62 million Americans was in prime time for household formation. Millennials are a notably larger pool of pent-up demand, versus Generation X, which numbered 55 million.
The size of starter home demand was likely 10 to 15 percent larger.
Second, in 2018, according to this Pew Research study released in February 2019, 15% of Millennials (ages 25 to 37) were living in their parents’ home.
This was nearly double the share of early Baby Boomer and Silent Generation data (at 8% each), and 6 percentage points higher than Gen Xers who did so when they were the same age.
Living in your parents’ home so, so long? That clearly got old. It was a circumstance these new households, starting their own families, desperately wanted out of.
Finally, the COVID-related stock market boom made all downpayment kitties much larger.
Both new and old households shifted from stocks to owning a house. Based on the data, it looks like luxury home buyer demand led the way.
4. 30-Year Fixed Mortgage Rates Near Record Lows
While U.S. mortgage rates are no longer at all-time records, they remain very near that bottom.
According to the FRED data I consulted, the average cost of a 30-year fixed-rate mortgage ticked down to a historic bottom at 2.75% of Jan. 7, 2021. Prior to the COVID pandemic, this number was around 3.5%.
A 75 basis-point reduction isn’t much. But it helps. Particularly, for those newbie Millennial buyers, without seasoned mortgages to refinance.
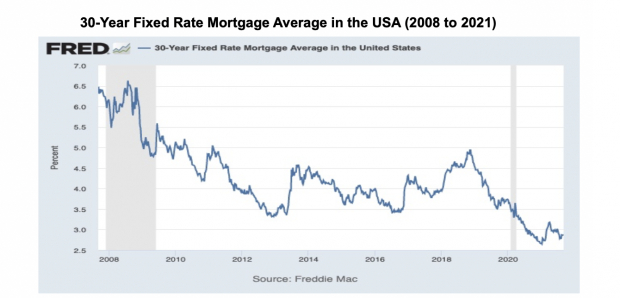
Image Source: Freddie Mac
The public FRED 30-yr fixed mortgage rate data above runs to August 19th, 2021.
Today’s 30-yr Fixed Mortgage rate is very near that 2.87% seen in the chart (above).
In brief, if the Fed did produce a home price bubble, it did not work thru the direct channel of transmission, of 30-year fixed mortgage interest rates.
Rather, the Fed may have produced a home price bubble thru wealth effects, by elevating the U.S. stock market indices with monthly bond buying liquidity.
Millennials can get a home directly from their relatives; get help with a down payment from relatives; and get loans more easily, with more wealth shown on their personal account balances.
Older generations can and likely did trade up.
I think it is fair to conclude — with a well-reasoned statement:
Regardless of what the Fed did the last 18 months, the first two supply factors (low Home Sales Inventory, and a lack of Home Construction), the Fed had nothing to do with.
Going forward, aggregate demand lifting factors, like vaccination, COVID booster shots and changes in Public Health hospitalization and suppression policies are also relevant.
The Fed does not control any of those levers. The Biden administration, or state and local governments, do.
COVID remote-working home-buying demand is also not a Fed-related factor.
The Fed can only work its elevating (or contracting) magic thru stimulating home aggregate demand, one way (mortgage rates) or another (personal and family balance sheet wealth effects).
Looking for a pre-COVID mark for the S&P500? February 9th, 2020, the S&P500 closed at 3,380.
According to historical records, the average annual return since its inception in 1926 through 2018 is approximately 10%–11%.
Writing down forward-looking S&P 500 returns arithmetic that is consistent with that?
The Fed on February 9th, 2022 is also not responsible for the S&P500 trading at 4,126.
On Sept. 8th, 2021 I see the S&P 500 trading at 4,516.
To close —
We may have +10% to +15% S&P500 overvaluation to attribute to the Fed’s policies the last 18 months.
Now scratch your head.
Tie this to the +16.2% home price run-up we saw during COVID.
Acknowledging that laundry list of macro demand and supply factors likely does not get you to jump out of your seat, screaming about the Fed’s COVID mortgage-backed bond buying policy.
Image: Bigstock
What Macro Factors Delivered a Surge to Record Home Prices?
This is an excerpt from our most recent Economic Outlook report. To access the full PDF, please click here.
A solo September 2021 fact — all-time record home prices — seems almost impossible.
But here we are. Dealing with another huge run-up in single-family U.S. home prices.
Remember that huge 2006-2009 price bust? Of course, you do. It took Wall Street and the entire U.S. economy down with it.
Even after that years-long ascent, the median price of homes sold in the USA rose +16.2% percent in one year from $322,600 Q2-20 to $374,900 in Q2-21 — to a new record, according to the Federal Reserve’s data.
That big a one-year run-up raises a key macro question: Why did U.S. home prices rise so fast over the last year?
In this narrative I unfurl: the first 3 macro factors — home supply and demand — mattered most.
The 4th macro factor, a fall in 30-year fixed home mortgage rates, mattered least.
That forced macro ranking, in and of itself, is important to understand. It implies current Federal Reserve policy towards mortgage rates may be overstated as a clean, one-step, direct driving factor.
If this steep home price ascent is indeed a Fed policy bubble, how it was caused is a more complex story.
Let me show you a salient timeline of U.S. macro facts to make my case:
Image Source: Federal Reserve Bank of St Louis
This housing price surge phenomenon — to a new record — bears a deeper dive.
In this economist’s thinking, there are four major fundamental macro factors:
1. U.S. Home Inventory for Sale Collapsed
When the wave of public health-driven COVID shutdown orders hit the USA, in March of 2020, there was little choice. People stayed in their homes, and did not sell them.
What else could they do?
By October of 2020, the Monthly Supply of Houses in the USA fell to 3.5 months. Going back to 1963, that number (3.5) was only hit one other time, from June to August of 2003.
How does this compare, during this more recent, over decade-long cycle?
In July 2021, the Monthly Supply in the USA shot up to 6.2.
In Sept. 2021, unique U.S. home market COVID shutdown circumstances are likely over. Much like the jobs market, after the vaccination-driven opening, sales offerings of homes shot up.
Consult the FRED chart below on all of this:
Image Source: Federal Reserve Bank of St Louis
2. Home Builders Got Shut-In
Looking across the last 50 years of available FRED new privately-owned housing units data shows you something of a base case for thinking.
Generally, the U.S. annual private home starts average is 1.6M, with 1.2M as the bottom of the range and 2.0M as the top of the range.
Shutdown orders did apply to construction firms. So, in April 2020, that number fell to just 938K.
Image Source: Census, HUD
The latest June and July numbers for the USA starts is back to that 1.6 million number.
Again, don’t get fooled.
In the fall of 2021, the unique U.S. starts — fresh building supply — circumstance is likely over, too.
3. Pent-Up Millennial Buyer Demand Surged
When needing to think about U.S. generation cohorts, and their housing demand, Pew Research is a good starting point.
Pew Research conveniently put together the following table in February 2019—
Silent Generation:
Born: 1928 to 1945
Age in 2018: 73 to 90
Baby Boomer:
Born: 1946 to 1964
Age in 2018: 54 to 72
Generation X:
Born 1965 to 1980
Age in 2018: 38 to 53
Millennial:
Born: 1981 to 1996
Age in 2018: 22 to 37
Generation Z:
Born: 1997 to 2012
Age in 2018: 6 to 21
First, entering COVID, the Millennial generation of 62 million Americans was in prime time for household formation. Millennials are a notably larger pool of pent-up demand, versus Generation X, which numbered 55 million.
The size of starter home demand was likely 10 to 15 percent larger.
Second, in 2018, according to this Pew Research study released in February 2019, 15% of Millennials (ages 25 to 37) were living in their parents’ home.
This was nearly double the share of early Baby Boomer and Silent Generation data (at 8% each), and 6 percentage points higher than Gen Xers who did so when they were the same age.
Living in your parents’ home so, so long? That clearly got old. It was a circumstance these new households, starting their own families, desperately wanted out of.
Finally, the COVID-related stock market boom made all downpayment kitties much larger.
Both new and old households shifted from stocks to owning a house. Based on the data, it looks like luxury home buyer demand led the way.
4. 30-Year Fixed Mortgage Rates Near Record Lows
While U.S. mortgage rates are no longer at all-time records, they remain very near that bottom.
According to the FRED data I consulted, the average cost of a 30-year fixed-rate mortgage ticked down to a historic bottom at 2.75% of Jan. 7, 2021. Prior to the COVID pandemic, this number was around 3.5%.
A 75 basis-point reduction isn’t much. But it helps. Particularly, for those newbie Millennial buyers, without seasoned mortgages to refinance.
Image Source: Freddie Mac
The public FRED 30-yr fixed mortgage rate data above runs to August 19th, 2021.
Today’s 30-yr Fixed Mortgage rate is very near that 2.87% seen in the chart (above).
In brief, if the Fed did produce a home price bubble, it did not work thru the direct channel of transmission, of 30-year fixed mortgage interest rates.
Rather, the Fed may have produced a home price bubble thru wealth effects, by elevating the U.S. stock market indices with monthly bond buying liquidity.
Millennials can get a home directly from their relatives; get help with a down payment from relatives; and get loans more easily, with more wealth shown on their personal account balances.
Older generations can and likely did trade up.
I think it is fair to conclude — with a well-reasoned statement:
Regardless of what the Fed did the last 18 months, the first two supply factors (low Home Sales Inventory, and a lack of Home Construction), the Fed had nothing to do with.
Going forward, aggregate demand lifting factors, like vaccination, COVID booster shots and changes in Public Health hospitalization and suppression policies are also relevant.
The Fed does not control any of those levers. The Biden administration, or state and local governments, do.
COVID remote-working home-buying demand is also not a Fed-related factor.
The Fed can only work its elevating (or contracting) magic thru stimulating home aggregate demand, one way (mortgage rates) or another (personal and family balance sheet wealth effects).
Looking for a pre-COVID mark for the S&P500? February 9th, 2020, the S&P500 closed at 3,380.
According to historical records, the average annual return since its inception in 1926 through 2018 is approximately 10%–11%.
Writing down forward-looking S&P 500 returns arithmetic that is consistent with that?
The Fed on February 9th, 2022 is also not responsible for the S&P500 trading at 4,126.
On Sept. 8th, 2021 I see the S&P 500 trading at 4,516.
To close —
We may have +10% to +15% S&P500 overvaluation to attribute to the Fed’s policies the last 18 months.
Now scratch your head.
Tie this to the +16.2% home price run-up we saw during COVID.
Acknowledging that laundry list of macro demand and supply factors likely does not get you to jump out of your seat, screaming about the Fed’s COVID mortgage-backed bond buying policy.