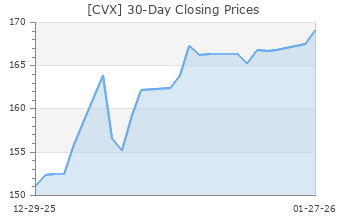
Chevron (CVX)
(Real Time Quote from BATS)
$164.98 USD
+1.41 (0.86%)
Updated Apr 25, 2024 03:51 PM ET
After-Market: $165.23 +0.25 (0.15%) 4:08 PM ET
3-Hold of 5 3
B Value C Growth A Momentum A VGM
Company Summary
Chevron is one of the largest publicly traded oil and gas companies in the world with operations that span almost every corner of the globe. The only energy component of the Dow Jones Industrial Average, San Ramon, CA-based Chevron is fully integrated, meaning it participates in every aspect related to energy – from oil production, to refining and marketing. The company generates more than $200 billion in annual revenues and produces over three million barrels per day of oil equivalent. Chevron currently churns out oil and natural gas at a 59/41 ratio. As of the end of 2023, the ...
Company Summary
Chevron is one of the largest publicly traded oil and gas companies in the world with operations that span almost every corner of the globe. The only energy component of the Dow Jones Industrial Average, San Ramon, CA-based Chevron is fully integrated, meaning it participates in every aspect related to energy – from oil production, to refining and marketing. The company generates more than $200 billion in annual revenues and produces over three million barrels per day of oil equivalent. Chevron currently churns out oil and natural gas at a 59/41 ratio. As of the end of 2023, the company had proved reserves of approximately 14.5 billion barrels of oil-equivalent.
The energy sector's revival from the pandemic-induced lows have significantly buoyed Chevron’s stock price and it is currently the 25-largest company in the S&P 500 Index. With its relatively low-risk energy business structure, robust financial health, and ample free cash flows, Chevron remains well positioned to navigate the volatility in oil and gas prices.
Being an integrated firm engaged in all aspects of the oil and gas business, Chevron often finds itself in the crossfire of political debates over climate change policy. Notwithstanding these distractions, Chevron has improved its cash from operations, allowing management to raise the dividend regularly. One of only two energy stocks on the list of Dividend Aristocrats, the supermajor’s balance sheet is reasonably healthy indicating that the dividend should remain safe going forward.
Chevron has a market cap of around $285 billion and divides its operations into two main segments: Upstream (exploration & production) and Downstream (refining). In 2023, the Upstream unit reported a profit of $17.4 billion, while the Downstream segment generated earnings of $6.1 billion. Chevron’s other activities include transportation (pipelines, shipping) and chemicals (handled by Chevron Phillips Chemicals Company, a 50/50 joint venture with partner Phillips 66). Chevron’s current oil and gas development project pipeline is among the best in the industry, which is projected to grow its output by around 4-7% year over year in 2024. This production growth will primarily come from Chevron’s showpiece Permian Basin assets, where it has substantial holdings of 2.2 million net acres.
General Information
Chevron Corporation
6001 BOLLINGER CANYON ROAD
SAN RAMON, CA 94583
Phone: 925-842-1000
Fax: 415-894-6817
Email: invest@chevron.com
| Industry | Oil and Gas - Integrated - International |
| Sector | Oils-Energy |
| Fiscal Year End | December |
| Last Reported Quarter | 3/31/2024 |
| Earnings Date | 4/26/2024 |
EPS Information
| Current Quarter EPS Consensus Estimate | 2.84 |
| Current Year EPS Consensus Estimate | 13.58 |
| Estimated Long-Term EPS Growth Rate | 5.00 |
| Earnings Date | 4/26/2024 |
Price and Volume Information
| Zacks Rank | |
| Yesterday's Close | 163.57 |
| 52 Week High | 171.70 |
| 52 Week Low | 139.62 |
| Beta | 1.12 |
| 20 Day Moving Average | 7,013,933.00 |
| Target Price Consensus | 181.90 |

| 4 Week | 4.62 |
| 12 Week | 10.95 |
| YTD | 9.66 |
| 4 Week | 8.27 |
| 12 Week | 6.00 |
| YTD | 3.14 |
| Shares Outstanding (millions) | 1,857.27 |
| Market Capitalization (millions) | 303,793.53 |
| Short Ratio | NA |
| Last Split Date | 9/13/2004 |
| Dividend Yield | 3.99% |
| Annual Dividend | $6.52 |
| Payout Ratio | 0.46 |
| Change in Payout Ratio | -0.43 |
| Last Dividend Payout / Amount | 2/15/2024 / $1.63 |
Fundamental Ratios
| P/E (F1) | 12.04 |
| Trailing 12 Months | 12.46 |
| PEG Ratio | 2.41 |
| vs. Previous Year | -15.65% |
| vs. Previous Quarter | 13.11% |
| vs. Previous Year | -16.46% |
| vs. Previous Quarter | -12.76% |
| Price/Book | 1.91 |
| Price/Cash Flow | 7.35 |
| Price / Sales | 1.51 |
| 3/31/24 | NA |
| 12/31/23 | 15.24 |
| 9/30/23 | 16.15 |
| 3/31/24 | NA |
| 12/31/23 | 9.56 |
| 9/30/23 | 10.14 |
| 3/31/24 | NA |
| 12/31/23 | 1.27 |
| 9/30/23 | 1.25 |
| 3/31/24 | NA |
| 12/31/23 | 1.01 |
| 9/30/23 | 0.97 |
| 3/31/24 | NA |
| 12/31/23 | 12.29 |
| 9/30/23 | 12.41 |
| 3/31/24 | NA |
| 12/31/23 | 10.63 |
| 9/30/23 | 12.11 |
| 3/31/24 | NA |
| 12/31/23 | 14.72 |
| 9/30/23 | 17.08 |
| 3/31/24 | NA |
| 12/31/23 | 85.78 |
| 9/30/23 | 88.07 |
| 3/31/24 | NA |
| 12/31/23 | 13.54 |
| 9/30/23 | 14.10 |
| 3/31/24 | NA |
| 12/31/23 | 0.13 |
| 9/30/23 | 0.12 |
| 3/31/24 | NA |
| 12/31/23 | 11.14 |
| 9/30/23 | 10.80 |

