DraftKings (DKNG)
(Delayed Data from NSDQ)
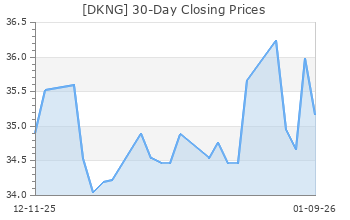
$40.85 USD
-0.36 (-0.87%)
Updated Apr 24, 2024 04:00 PM ET
After-Market: $40.30 -0.55 (-1.35%) 7:58 PM ET
3-Hold of 5 3
F Value A Growth D Momentum C VGM
Company Summary
DraftKings Inc. is a digital sports entertainment and gaming company created to fuel the competitive spirits of sports fans with products that range across daily fantasy, regulated gaming and digital media. DraftKings is the only U.S.-based vertically integrated sports betting operator. DraftKings is a multi-channel provider of sports betting and gaming technologies, powering sports and gaming entertainment for 50 operators across more than 15 regulated U.S. and global markets, including Arkansas and Oregon in the U.S. DraftKings' Sportsbook offers mobile and retail betting for major U.S. and international sports and operates in the United States pursuant to regulations in Colorado, Illinois, Indiana, Iowa, Mississippi, New Hampshire, New Jersey, New York, Pennsylvania, Tennessee and West Virginia. DraftKings is the official daily fantasy partner of the NFL, MLB and the PGA TOUR as well as an authorized gaming operator of the NBA and MLB and an official betting operator of the PGA TOUR.
Company Summary
General Information
DraftKings Inc
222 Berkeley Street 5th Floor
BOSTON, MA 02116
Phone: 617-986-6744
Fax: NA
Web: http://www.draftkings.com
Email: investors@draftkings.com
| Industry | Gaming |
| Sector | Consumer Discretionary |
| Fiscal Year End | December |
| Last Reported Quarter | 3/31/2024 |
| Earnings Date | 5/2/2024 |
EPS Information
| Current Quarter EPS Consensus Estimate | -0.28 |
| Current Year EPS Consensus Estimate | -0.24 |
| Estimated Long-Term EPS Growth Rate | NA |
| Earnings Date | 5/2/2024 |
Price and Volume Information
| Zacks Rank | |
| Yesterday's Close | 41.21 |
| 52 Week High | 49.57 |
| 52 Week Low | 20.26 |
| Beta | 1.86 |
| 20 Day Moving Average | 10,268,690.00 |
| Target Price Consensus | 50.18 |
| 4 Week | -15.35 |
| 12 Week | 2.28 |
| YTD | 16.91 |
| 4 Week | -10.38 |
| 12 Week | 0.35 |
| YTD | 9.51 |
| Shares Outstanding (millions) | 866.63 |
| Market Capitalization (millions) | 35,713.96 |
| Short Ratio | NA |
| Last Split Date | NA |
| Dividend Yield | 0.00% |
| Annual Dividend | $0.00 |
| Payout Ratio | NA |
| Change in Payout Ratio | NA |
| Last Dividend Payout / Amount | NA / $0.00 |
Fundamental Ratios
| P/E (F1) | NA |
| Trailing 12 Months | NA |
| PEG Ratio | NA |
| vs. Previous Year | 81.13% |
| vs. Previous Quarter | 83.61% |
| vs. Previous Year | 43.94% |
| vs. Previous Quarter | 55.81% |
| Price/Book | 42.46 |
| Price/Cash Flow | NA |
| Price / Sales | 9.74 |
| 3/31/24 | NA |
| 12/31/23 | -87.24 |
| 9/30/23 | -96.17 |
| 3/31/24 | NA |
| 12/31/23 | -21.18 |
| 9/30/23 | -26.24 |
| 3/31/24 | NA |
| 12/31/23 | 1.34 |
| 9/30/23 | 1.29 |
| 3/31/24 | NA |
| 12/31/23 | 1.34 |
| 9/30/23 | 1.29 |
| 3/31/24 | NA |
| 12/31/23 | -21.88 |
| 9/30/23 | -30.41 |
| 3/31/24 | NA |
| 12/31/23 | -21.88 |
| 9/30/23 | -30.41 |
| 3/31/24 | NA |
| 12/31/23 | -21.59 |
| 9/30/23 | -29.98 |
| 3/31/24 | NA |
| 12/31/23 | 0.97 |
| 9/30/23 | 0.93 |
| 3/31/24 | NA |
| 12/31/23 | NA |
| 9/30/23 | NA |
| 3/31/24 | NA |
| 12/31/23 | 1.49 |
| 9/30/23 | 1.56 |
| 3/31/24 | NA |
| 12/31/23 | 59.87 |
| 9/30/23 | 60.99 |