Jabil (JBL)
(Delayed Data from NYSE)
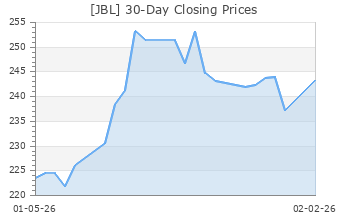
$132.66 USD
-1.41 (-1.05%)
Updated Apr 15, 2024 04:00 PM ET
After-Market: $132.61 -0.05 (-0.04%) 7:58 PM ET
3-Hold of 5 3
A Value B Growth D Momentum B VGM
Company Summary
Headquartered in St. Petersburg, FL, Jabil, Inc., is one of the largest global suppliers of electronic manufacturing services. The company offers electronics design, production, product management and after-market services to customers catering to aerospace, automotive, computing, consumer, defense, industrial, instrumentation, medical, networking, peripherals, storage and telecommunications industries.
Jabil reported revenues of $6,767 million in the second quarter of fiscal 2024.
Beginning fiscal 2015, Jabil has two reporting segments: Electronics Manufacturing Services (EMS) segment and Diversified Manufacturing Services (DMS). The EMS segment includes enterprise and infrastructure, high velocity, and industrial energy businesses whereas the DMS segment ...
Company Summary
Headquartered in St. Petersburg, FL, Jabil, Inc., is one of the largest global suppliers of electronic manufacturing services. The company offers electronics design, production, product management and after-market services to customers catering to aerospace, automotive, computing, consumer, defense, industrial, instrumentation, medical, networking, peripherals, storage and telecommunications industries.
Jabil reported revenues of $6,767 million in the second quarter of fiscal 2024.
Beginning fiscal 2015, Jabil has two reporting segments: Electronics Manufacturing Services (EMS) segment and Diversified Manufacturing Services (DMS). The EMS segment includes enterprise and infrastructure, high velocity, and industrial energy businesses whereas the DMS segment will include Jabil’s Nypro and Green Point brands.
The EMS segment (49% of second quarter fiscal 2024 revenues) is focused on leveraging IT, supply chain design and engineering, technologies largely centered on core electronics, sharing of large scale manufacturing infrastructure and serving a broad range of end markets. EMS segment is typically a low margin but high-volume business that manufactures products at a quicker cycle time and in larger quantities. The EMS segment includes customers primarily in the automotive, computing, digital home, energy, industrial, networking, printing, storage and telecommunications industries.
The DMS segment (51% of second quarter fiscal 2024 revenues) is focused on providing engineering solutions, heavy participation in consumer markets, access to higher growth markets and a focus on material sciences and technologies. The DMS segment is a high-margin business and includes customers primarily from the consumer lifestyles, health care, mobility and packaging industries.
The company’s largest customers included Apple, Cisco, Hewlett-Packard Company, Keysight Technologies, LM Ericsson, NetApp, Nokia Networks, SolarEdge Technologies, Valeo S.A. and Zebra Technologies.
The company faces significant competition from the likes of Benchmark Electronics, Celestica, Flex, Hon-Hai Precision Industry, Plexus and Sanmina.
General Information
Jabil, Inc
10800 ROOSEVELT BOULEVARD NORTH
ST PETERSBURG, FL 33716
Phone: 727-577-9749
Fax: 727-579-8529
Web: http://www.jabil.com
Email: investor_relations@jabil.com
| Industry | Electronics - Manufacturing Services |
| Sector | Computer and Technology |
| Fiscal Year End | August |
| Last Reported Quarter | 2/29/2024 |
| Exp Earnings Date | 6/20/2024 |
EPS Information
| Current Quarter EPS Consensus Estimate | 1.90 |
| Current Year EPS Consensus Estimate | 8.41 |
| Estimated Long-Term EPS Growth Rate | 12.00 |
| Exp Earnings Date | 6/20/2024 |
Price and Volume Information
| Zacks Rank | |
| Yesterday's Close | 134.07 |
| 52 Week High | 156.94 |
| 52 Week Low | 75.48 |
| Beta | 1.40 |
| 20 Day Moving Average | 1,184,627.62 |
| Target Price Consensus | 149.29 |
| 4 Week | 6.83 |
| 12 Week | 5.79 |
| YTD | 4.13 |
| 4 Week | 8.68 |
| 12 Week | 1.37 |
| YTD | -2.03 |
| Shares Outstanding (millions) | 120.60 |
| Market Capitalization (millions) | 15,998.44 |
| Short Ratio | NA |
| Last Split Date | 3/31/2000 |
| Dividend Yield | 0.24% |
| Annual Dividend | $0.32 |
| Payout Ratio | 0.04 |
| Change in Payout Ratio | -0.11 |
| Last Dividend Payout / Amount | 2/14/2024 / $0.08 |
Fundamental Ratios
| P/E (F1) | 15.77 |
| Trailing 12 Months | 15.21 |
| PEG Ratio | 1.31 |
| vs. Previous Year | -12.50% |
| vs. Previous Quarter | -33.62% |
| vs. Previous Year | -16.81% |
| vs. Previous Quarter | -19.32% |
| Price/Book | 6.02 |
| Price/Cash Flow | 8.68 |
| Price / Sales | 0.50 |
| 2/29/24 | 39.47 |
| 11/30/23 | 41.09 |
| 8/31/23 | 38.02 |
| 2/29/24 | 5.65 |
| 11/30/23 | 5.71 |
| 8/31/23 | 5.21 |
| 2/29/24 | 1.17 |
| 11/30/23 | 1.12 |
| 8/31/23 | 1.16 |
| 2/29/24 | 0.72 |
| 11/30/23 | 0.73 |
| 8/31/23 | 0.75 |
| 2/29/24 | 3.32 |
| 11/30/23 | 3.32 |
| 8/31/23 | 2.96 |
| 2/29/24 | 4.70 |
| 11/30/23 | 2.36 |
| 8/31/23 | 2.36 |
| 2/29/24 | 6.15 |
| 11/30/23 | 3.58 |
| 8/31/23 | 3.64 |
| 2/29/24 | 22.04 |
| 11/30/23 | 19.71 |
| 8/31/23 | 21.91 |
| 2/29/24 | 5.50 |
| 11/30/23 | 5.33 |
| 8/31/23 | 5.25 |
| 2/29/24 | 1.08 |
| 11/30/23 | 1.13 |
| 8/31/23 | 1.00 |
| 2/29/24 | 51.99 |
| 11/30/23 | 53.14 |
| 8/31/23 | 50.07 |