Qualcomm (QCOM)
(Delayed Data from NSDQ)
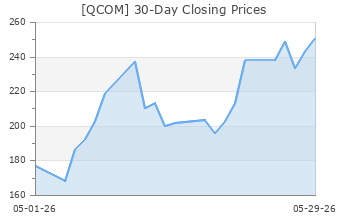
$169.84 USD
-1.45 (-0.85%)
Updated Apr 15, 2024 04:00 PM ET
After-Market: $169.38 -0.46 (-0.27%) 7:58 PM ET
3-Hold of 5 3
D Value A Growth D Momentum C VGM
Company Summary
Headquartered in San Diego, CA, Qualcomm Incorporated designs, manufactures and markets digital wireless telecom products and services based on the Code Division Multiple Access (CDMA) technology. The products include CDMA-based integrated circuits (ICs) and system software for wireless voice and data communications as well as global positioning system (GPS) products. The company also offers development and other product related services to the U.S. government agencies and their contractors. Qualcomm's business is organized into two reporting segments as follows:
Qualcomm CDMA Technologies (QCT) (84.8% of total revenues in first-quarter fiscal 2024): This segment reports operating ...
Company Summary
Headquartered in San Diego, CA, Qualcomm Incorporated designs, manufactures and markets digital wireless telecom products and services based on the Code Division Multiple Access (CDMA) technology. The products include CDMA-based integrated circuits (ICs) and system software for wireless voice and data communications as well as global positioning system (GPS) products. The company also offers development and other product related services to the U.S. government agencies and their contractors. Qualcomm's business is organized into two reporting segments as follows:
Qualcomm CDMA Technologies (QCT) (84.8% of total revenues in first-quarter fiscal 2024): This segment reports operating results for sales of CDMA-based integrated circuit devices (chips) and system software for wireless voice and data communications, as well as GPS products. QCT's integrated circuit (IC) products are used mainly in mobile phones, wireless data access cards and infrastructure equipment. The segment is also responsible for supplying products which are specifically designed for the implementation of small cells.
Qualcomm Technology Licensing (QTL) (14.7%): This segment reports revenues received from licenses to the intellectual property portfolio, which comprises various patent rights used in the manufacture and sale of wireless products, including Wideband Code Division Multiple Access (WCDMA) technology solutions. QTL generates revenues from license fees as well as royalties based on global sales by licensees of products incorporating or using Qualcomm's intellectual property.
General Information
QUALCOMM Incorporated
5775 MOREHOUSE DRIVE
SAN DIEGO, CA 92121
Phone: 858-587-1121
Fax: 858-658-2100
Email: ir@qualcomm.com
| Industry | Wireless Equipment |
| Sector | Computer and Technology |
| Fiscal Year End | September |
| Last Reported Quarter | 3/31/2024 |
| Exp Earnings Date | 5/1/2024 |
EPS Information
| Current Quarter EPS Consensus Estimate | 2.31 |
| Current Year EPS Consensus Estimate | 9.57 |
| Estimated Long-Term EPS Growth Rate | 9.50 |
| Exp Earnings Date | 5/1/2024 |
Price and Volume Information
| Zacks Rank | |
| Yesterday's Close | 171.29 |
| 52 Week High | 177.59 |
| 52 Week Low | 101.47 |
| Beta | 1.41 |
| 20 Day Moving Average | 6,162,749.50 |
| Target Price Consensus | 157.67 |
| 4 Week | 2.45 |
| 12 Week | 12.72 |
| YTD | 18.43 |
| 4 Week | 2.32 |
| 12 Week | 6.48 |
| YTD | 10.26 |
| Shares Outstanding (millions) | 1,116.00 |
| Market Capitalization (millions) | 191,159.63 |
| Short Ratio | NA |
| Last Split Date | 8/16/2004 |
| Dividend Yield | 1.87% |
| Annual Dividend | $3.20 |
| Payout Ratio | 0.46 |
| Change in Payout Ratio | -0.10 |
| Last Dividend Payout / Amount | 2/28/2024 / $0.80 |
Fundamental Ratios
| P/E (F1) | 17.75 |
| Trailing 12 Months | 19.32 |
| PEG Ratio | 1.86 |
| vs. Previous Year | 20.73% |
| vs. Previous Quarter | 46.54% |
| vs. Previous Year | 4.99% |
| vs. Previous Quarter | 15.11% |
| Price/Book | 8.22 |
| Price/Cash Flow | 19.77 |
| Price / Sales | 5.22 |
| 3/31/24 | NA |
| 12/31/23 | 38.06 |
| 9/30/23 | 37.85 |
| 3/31/24 | NA |
| 12/31/23 | 16.14 |
| 9/30/23 | 15.40 |
| 3/31/24 | NA |
| 12/31/23 | 2.56 |
| 9/30/23 | 2.33 |
| 3/31/24 | NA |
| 12/31/23 | 1.88 |
| 9/30/23 | 1.67 |
| 3/31/24 | NA |
| 12/31/23 | 22.29 |
| 9/30/23 | 21.33 |
| 3/31/24 | NA |
| 12/31/23 | 21.39 |
| 9/30/23 | 20.19 |
| 3/31/24 | NA |
| 12/31/23 | 22.14 |
| 9/30/23 | 20.78 |
| 3/31/24 | NA |
| 12/31/23 | 20.66 |
| 9/30/23 | 19.39 |
| 3/31/24 | NA |
| 12/31/23 | 2.47 |
| 9/30/23 | 2.37 |
| 3/31/24 | NA |
| 12/31/23 | 0.63 |
| 9/30/23 | 0.67 |
| 3/31/24 | NA |
| 12/31/23 | 38.72 |
| 9/30/23 | 40.16 |