|
Feb 07, 2026 |
Equifax Inc. (NYSE: EFX)$195.62 USD ( As of 02/06/26 ) |
|
|||||||||||||
Data Overview
| 52 Week High-Low | $280.54 - $175.05 |
|---|---|
| 20 Day Average Volume | 2,089,058 |
| Beta | 1.55 |
| Market Cap | 23.38 B |
| Dividend / Div Yld | $2.00 / 1.05% |
| Industry | Consulting Services |
| Industry Rank | 93 / 243 (Top 38%) |
| Current Ratio | 0.60 |
| Debt/Capital | 47.42% |
| Net Margin | 10.87% |
| Price/Book (P/B) | 5.06 |
| Price/Cash Flow (P/CF) | 13.95 |
| Earnings Yield | 4.53% |
| Debt/Equity | 0.88 |
| Value Score | |
|---|---|
| P/E (F1) | 22.06 |
| P/E (F1) Rel to Industry | 8.97 |
| PEG Ratio | 1.94 |
| P/S (F1) | 3.85 |
| P/S (TTM) | 3.85 |
| P/CFO | 13.95 |
| P/CFO Rel to Industry | 0.35 |
| EV/EBITDA Annual | 15.84 |
| Growth Score | |
|---|---|
| Proj. EPS Growth (F1/F0) | 13.20% |
| Hist. EPS Growth (Q0/Q-1) | -1.29% |
| Qtr CFO Growth | 27.52 |
| 2 Yr CFO Growth | 41.30 |
| Return on Equity (ROE) | 19.27% |
| (NI - CFO) / Total Assets | NA |
| Asset Turnover | 0.51 |
| Momentum Score | |
|---|---|
| 1 week Volume change | 29.03% |
| 1 week Price Cng Rel to Industry | -6.37% |
| (F1) EPS Est 1 week change | 0.03% |
| (F1) EPS Est 4 week change | -3.23% |
| (F1) EPS Est 12 week change | -1.80% |
| (Q1) EPS Est 1 week change | -6.50% |
Summary
The recent cyber attack at Equifax, under which criminals stole highly sensitive personal data of approximately 143 million of its consumers, has heavily tarnished the brand image, reputation and credibility of the company. The company is facing huge customer criticism, while cybersecurity companies are questioning its preparedness and response to this massive data breach. Moreover, with lawmakers and investigating agencies probing the mishap, troubles for Equifax are unlikely to end any time soon. We are concerned that the entire issue may result in loss of customers and the company may also have to make huge compensation to its clients. We believe the incident will certainly have an adverse impact on the company’s financial performance in the near term. Additionally, uncertainty surrounding IT spending and strong U.S. dollar are some other concerns. Notably, the stock has underperformed the industry in the last one year.
Elements of the Zacks Rank
Agreement Estimate Revisions (60 days)
|
83% Q1 (Current Qtr)Revisions: 12 Up: 2 Down: 10 |
100% Q2 (Next Qtr)Revisions: 13 Up: 0 Down: 13 |
92% F1 (Current Year)Revisions: 13 Up: 1 Down: 12 |
100% F2 (Next Year)Revisions: 11 Up: 0 Down: 11 |
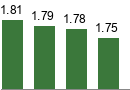
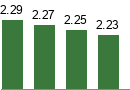
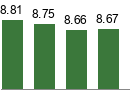
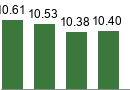
Magnitude Consensus Estimate Trend (60 days)
|
||||||||||
|
||||||||||
|
||||||||||
|
||||||||||
Upside Zacks Consensus Estimate vs. Most Accurate Estimate
|
|
|
|
|
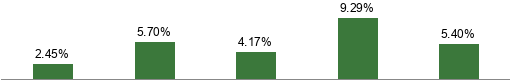
Surprise Reported Earnings History
|
|
|
|
Average 4 Qtr Surprise |
||||||||||||||||||||||||
The data on the front page and all the charts in the report represent market data as of 02/06/26, while the report's text is as of 10/02/2017
Overview

Headquartered in Atlanta, GA, Equifax Inc. (EFX) is a leading information services provider to consumers and businesses. The company's products and services help customers make better credit and marketing decisions via its databases of consumer and business information derived from numerous types of credit, financial, public record, and demographic data. Equifax provides consumers with credit information such as scoring and reporting and helps to manage the problem of identity theft. The company operates in North America, Europe and Latin America. Equifax serves clients across a wide range of industries, such as financial, mortgage, consumer, employees, telecommunications, automotive, commercial, retail, government, resellers, and others.
Equifax divides its businesses into four operating segments — U.S. Information Solutions (USIS), International, Workforce Solutions and Global Consumer Solutions.
The U.S. Information Solutions segment consists of consumer and commercial information services (like online information, fraud detection, consultancy services, financial marketing services, mortgage loan origination information etc.). This segment accounted for roughly 39% of Equifax’s 2016 total revenue. The International segment comprises Canada, Europe and Latin America business units. It consists of information services products, inclusive of consumer and commercial services (credit and financial information, credit scoring and credit modeling) and credit marketing products and services sold directly to consumers. This segment contributed roughly 26% of Equifax’s 2016 total revenue. Workforce Solutions segment consists of the Verification Services and Employer Services business units. This segment garnered roughly 22% of Equifax’s 2016 total revenue. Global Consumer Solutions revenues are both transaction- and subscription-based and are derived from the sale of credit monitoring and identity theft protection products, which the company delivers to consumers through mail and via the Internet. This segment recorded roughly 13% of Equifax’s 2016 total revenue.

Reasons To Sell:
The massive data breach at Equifax will certainly have an adverse impact on its financial performance in the near term. Stiff competition from peers and uncertainty in the mortgage sector are other concerns.
The recent cyber attack at Equifax, under which criminals stolen highly sensitive personal data of approximately 143 million of its consumers, has heavily tarnished the brand image, reputation and credibility of the company. The company is facing huge customer criticism, while cybersecurity companies are questioning its preparedness and response to this massive data breach. Moreover, with lawmakers and investigating agencies probing the mishap, troubles for Equifax are unlikely to end any time soon. We are concerned that the entire issue may result in loss of customers and the company may also have to make huge compensation to its clients. We believe that the incident will certainly have an adverse impact on the company’s financial performance in the near term.
There is intense competition in Brazil, one of the faster-growing markets in the world. Equifax’s archrival Experian acquired almost 100% of Brazilian credit data provider Serasa in Oct 2012. Initially, Experian had acquired 70% of Serasa in 2007. Serasa commands roughly 60% market share in Brazil, which is a key driver for Experian. Considering the significant potential for growth of the credit services market in Brazil, it is expected that Experian will be able to capitalize on the opportunities leveraging Serasa’s capabilities. This could put a lid on Equifax’s growth potential in Brazil. Also, competition from TransUnion LLC, which provides similar offerings as Experian could temper growth of the company to an extent. Also, Automatic Data Processing, Inc., Paychex, Inc. and Ceridian Corporation pose challenges.
Equifax is under consistent regulatory scrutiny. The company has to comply with various legal acts and formalities. Equifax is being regulated by the Federal Trade Commission (FTC) under the Fair Credit Reporting Act (FCRA) and the Fair and Accurate Credit Transactions Act (FACT) Act (2003), Financial Services Modernization Act (1999), Health Insurance Portability and Accountability Act (1996), Dodd-Frank Wall Street Reform and Consumer Protection Act (2010). Any violation of or changes in these rules could adversely impact operating results.
Close association with the mortgage industry could prove challenging at times. With a sharp decline in U.S. mortgage originations driven by slowing housing sales and a sagging sub-prime lending market, Equifax experienced double-digit decline in its Mortgage Reporting Solutions business in 2007. The mortgage industry is highly dependent on housing sales, interest rates and refinancing activities. In 2014, there was a slowdown in overall economic activity in the U.S. and a year-over-year decline in consumer mortgage activity. This in turn resulted in a decline in mortgage related revenues. In 2016, Equifax predicts a challenging business environment across the globe. Therefore, the prevailing uncertainty in global business environment may pose difficulty in new business generation for financial institutions and hence credit reports from Equifax may see lower demand. This may have a negative impact on Equifax’s 2017 revenues.
Equifax has a highly leveraged balance sheet. The company’s long-term debt (excluding current portion) were $2.04 billion as of Jun 30, 2017 while it has only $403.9 million as cash and cash equivalents. Therefore, Equifax needs to generate adequate amount of operating cash flow to service its debt.
Risks
- Equifax has made strategic acquisitions to supplement its core business. The company expects to derive 1% to 2% revenue growth from these acquisitions on a long-term basis. Most recently in June this year, the company entered into a definitive agreement to acquire ID Watchdog, one of the leading providers of identity theft protection and resolution services to the Employee Benefits marketplace. During the first quarter of 2016, Equifax completed the acquisition of Veda Group Limited, the leading Australian credit information provider. The company anticipates the acquisition to be accretive to the bottom line over the long run. Furthermore, in 2014, Equifax acquired two companies, namely TDX Group, a U.K.-based debt-management firm, for $322.8 million and Forseva, a provider of cloud-based credit management software solutions. These acquisitions have enabled Equifax to provide a broad insight into consumer performance, financial status, capabilities of customers and market opportunities. Moreover, it will further solidify Equifax’s presence in the U.K., which in turn will boost its revenues. During 2013, Equifax acquired several small companies in addition to TrustedID, a direct-to-consumer identity protection business. The company also completed the integration of the credit services business and assets that it got through the CSC Credit Services, Inc. acquisition.
- Apart from acquisitions, Equifax has remained enthusiastic about forming joint ventures that could expand its business internationally. Joint ventures keep operating costs down and need no integration time while diversifying the revenue source. To tap the immense growth opportunity in the Brazilian credit data market, Equifax merged credit reporting operations of its Brazilian subsidiary with Boa Vista Servicos S.A., the second-largest consumer credit bureau in Brazil. Equifax owns 15% equity interest in Boa Vista. Equifax also owns roughly 50% in Russia-based credit reporting agency, Global Payments Credit Services LLC, and 49% interest in the Indian credit reporting agency, Equifax Credit Information Services Private Limited (a joint venture between Equifax and 6 Indian financial institutions). The company expects its investments in the joint ventures to yield desired results and help it to register solid growth over the long term.
- Equifax serves a wide range of industries, such as financial, mortgage, consumer, employees, telecommunications, automotive, commercial, retail, government, resellers, and others. This diversified client base is extremely beneficial as weakness in any sector can be balanced with strength in the others. Notably, despite the strong connection with the financial industry, Equifax’s revenue concentration in the sector remains within 25% to 28%, while the rest comes from non-financial sectors. This is a good thing because the financial sector happens to be one of the most volatile and worst affected by recessions. Moreover, the largest customer of Equifax contributed only 2% to total revenue. Hence, lesser dependence on the financial sector and lower customer concentration risk are positives.
Last Earnings Report
Quarter Ending 12/2025
| Report Date | Feb 04, 2026 |
|---|---|
| Sales Surprise | 1.34% |
| EPS Surprise | 2.45% |
| Quarterly EPS | 2.09 |
| Annual EPS (TTM) | 7.66 |
Equifax Q2 Earnings Top, Revenues Miss, Updates View
Equifax reported mixed results for second-quarter 2017. The company’s adjusted earnings (excluding amortization expenses, Veda Group acquisition-related charges and other one-time items) per share from continuing operations of $1.60 surpassed the Zacks Consensus Estimate of $1.57 and also jumped 11.9% year over year.
On a GAAP basis, the company reported earnings of $1.36 per share, up from the year-ago quarter tally of $1.08 per share. The strong year-over-year bottom-line growth can primarily be attributed to solid top-line performance and stringent cost management, which was partially offset by a marginal increase in the number of total outstanding shares.
Details of the Quarter
Equifax’s revenues of $856.7 million lagged the Zacks Consensus Estimate of $861 million as well as management’s guided range of $857–$862 million. However, the figure was up 6% on a year-over-year basis.
According to Richard F. Smith, Chairman and Chief Executive Officer at Equifax, "Second quarter performance reflects outstanding execution by the team and the strength of our unique portfolio of businesses."
The company made slight changes in its reportable segments from first-quarter 2016. The U.S. Information Solutions (USIS) and Workforce Solutions remained unchanged, while Personal Solutions was renamed to Global Consumer Solutions.
Segment wise, total USIS revenues were up 8% year over year to $331.9 million. Among its sub-segments, growth was recorded in Online Information Solutions (6%), Mortgage Solutions Services (10%) and Financial Marketing Services (15%).
International revenues (including Europe, the Asia Pacific, Canada and Latin America) advanced 6% year over year to $231.4 million. On a constant-currency basis, revenues increased 10%. Growth was mainly driven by the Veda Group acquisition, which increased the Asia-Pacific region’s contribution to revenues to $76.5 million, up 6% year over year. Moreover, revenues registered an increase of 13%, 4% and 2% in Latin America, Canada and Europe, respectively.
Revenues from the Workforce Solutions segment climbed 10% year over year to $194.5 million, primarily on the back of 19% revenue growth in Verification Services, which more-than offset 5% decline in Employer Services.
Global Consumer Solutions contributed $98.9 million to total revenue, reflecting an 8% year-over-year decline. On a constant-currency basis, revenues dropped 7%.
Operating Results
Equifax’s adjusted EBITDA increased approximately 13% to $334.7 million. Consequently, adjusted operating EBITDA margin expanded 250 basis points (bps) to 39.1%. Adjusted net income came in at $194.8 million or $1.60 per share compared with $172.7 million or $1.43 per share reported a year ago.
Balance Sheet & Cash Flow
Equifax exited the quarter with $403.9 million in cash and cash equivalents, up from the previous quarter’s balance of $123.2 million. Total long-term debt (excluding current portion) was $2.04 billion, flat quarter over quarter. During six months ended Jun 30, 2017, Equifax generated cash flow of $329.1 million from operational activities. The company paid 39 cents per share as dividends in the second quarter.
Guidance
For the quarter, Equifax projects revenues in a range of $853–$861 million (mid-point: $857 million). Adjusted earnings per share are projected to be between $1.50 and $1.54 (midpoint: $1.52).
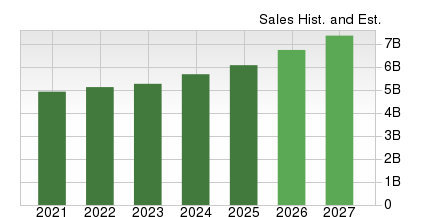
Furthermore, Equifax updated full-year 2017 outlook. The company now expects revenues in the range of $3.395–$3.425 billion (previous guidance $3.375–$3.425 billion). Adjusted earnings per share are now anticipated to be between $6.02 and $6.10 (previous guidance $5.96 and $6.10).
Recent News
On Sep 7, 2017, Equifax announced that highly sensitive personal data of approximately 143 million consumers has been stolen from its database. Reportedly, nearly two-third of the adult U.S. population has been affected due to this cyber attack.
On Aug 14, 2017, Equifax completed the acquisition of ID Watchdog in an all-cash deal. The company had entered into a definitive agreement to acquire ID Watchdog on Jun 16, 2017.
Industry Analysis(1)Zacks Industry Rank: NA

Top Peers
| Gartner, Inc. (IT) |
|
| Stantec Inc. (STN) |
|
| FTI Consulting, Inc. (FCN) |
|
| CBIZ, Inc. (CBZ) |
|
| Huron Consulting Group Inc. (HURN) |
|
| Charles River Associates (CRAI) |
|
| Exponent, Inc. (EXPO) |
|
| The Hackett Group, Inc. (HCKT) |
|
| Franklin Covey Company (FC) |
|
Industry Comparison Consulting Services | Position in Industry: 11 of 12 |
Industry Peers |
| EFX |
|
|---|---|
| Market Cap | 23.38 B |
| # of Analysts | 18 |
| Dividend Yield | 1.05% |
| Value Score | |
| Cash/Price | 0.01 |
| EV/EBITDA | 15.84 |
| PEG Ratio | 1.94 |
| Price/Book (P/B) | 5.06 |
| Price/Cash Flow (P/CF) | 13.95 |
| P/E (F1) | 22.06 |
| Price/Sales (P/S) | 3.85 |
| Earnings Yield | 4.53% |
| Debt/Equity | 0.88 |
| Cash Flow ($/share) | 13.69 |
| Growth Score | |
| Hist. EPS Growth (3-5 yrs) | -1.29% |
| Proj. EPS Growth (F1/F0) | 13.20% |
| Curr. Cash Flow Growth | 5.37% |
| Hist. Cash Flow Growth (3-5 yrs) | 9.23% |
| Current Ratio | 0.60 |
| Debt/Capital | 47.42% |
| Net Margin | 10.87% |
| Return on Equity | 19.27% |
| Sales/Assets | 0.51 |
| Proj. Sales Growth (F1/F0) | 8.66% |
| Momentum Score | |
| Daily Price Chg | 5.51% |
| 1 Week Price Chg | -6.37% |
| 4 Week Price Chg | -12.39% |
| 12 Week Price Chg | -7.72% |
| 52 Week Price Chg | -22.82% |
| 20 Day Average Volume | 2,089,058 |
| (F1) EPS Est Wkly Chg | -2.17% |
| (F1) EPS Est Mthly Chg | -3.23% |
| (F1) EPS Est Qtrly Chg | -3.96% |
| (Q1) EPS Est Mthly Chg | -6.19% |
| X Industry | S&P 500 |
|---|---|
| 2.08 B | 39.74 B |
| 4 | 22 |
| 0.00% | 1.36% |
| - | - |
| 0.06 | 0.04 |
| 15.84 | 14.95 |
| 1.62 | 1.97 |
| 4.27 | 3.66 |
| 15.37 | 15.48 |
| 19.29 | 18.81 |
| 1.50 | 3.13 |
| 5.18% | 5.28% |
| 0.43 | 0.57 |
| 2.99 | 8.99 |
| - | - |
| 14.27% | 8.04% |
| 8.97% | 9.25% |
| 10.07% | 6.74% |
| 7.23% | 7.76% |
| 1.57 | 1.19 |
| 30.12% | 38.14% |
| 6.54% | 12.75% |
| 18.32% | 17.16% |
| 1.06 | 0.53 |
| 3.77% | 5.31% |
| - | - |
| 0.52% | -1.23% |
| -3.54% | -2.45% |
| -4.58% | -1.78% |
| -1.46% | 0.90% |
| -21.14% | 11.75% |
| 199,876 | 3,086,422 |
| 0.00% | 0.00% |
| 0.00% | 0.00% |
| 0.28% | 0.27% |
| 0.00% | 0.00% |
| IT | STN | FCN |
|---|---|---|
| 10.96 B | 11.32 B | 5.48 B |
| 4 | 4 | 2 |
| 0.00% | 0.66% | 0.00% |
| 0.09 | 0.03 | 0.03 |
| 6.95 | 19.52 | 12.74 |
| NA | NA | NA |
| 19.92 | 3.50 | 3.13 |
| 8.98 | 18.84 | 16.47 |
| 11.14 | 23.32 | 19.29 |
| 1.69 | 1.98 | 1.48 |
| 8.98% | 4.28% | 5.18% |
| 4.42 | 0.53 | 0.29 |
| 16.93 | 5.27 | 10.77 |
| 20.18% | 18.36% | 7.24% |
| 3.61% | 13.32% | 9.07% |
| 19.21% | 17.16% | 10.07% |
| 17.97% | 28.78% | 7.38% |
| 0.88 | 1.27 | 1.85 |
| 81.56% | 34.45% | 22.57% |
| 11.22% | 6.06% | 7.20% |
| 83.48% | 17.37% | 14.49% |
| 0.81 | 0.99 | 1.06 |
| 1.16% | 10.13% | 6.22% |
| -3.67% | -1.52% | 1.84% |
| -28.52% | -1.77% | 1.60% |
| -38.40% | 2.16% | 0.80% |
| -33.95% | -5.25% | 7.54% |
| -71.55% | 29.80% | -8.27% |
| 1,628,191 | 232,916 | 210,512 |
| 1.33% | 0.00% | 0.00% |
| 0.81% | 0.95% | 0.00% |
| 1.01% | -3.90% | 0.00% |
| -1.30% | 0.69% | 0.00% |
Zacks Stock Rating System
We offer two rating systems that take into account investors' holding horizons; Zacks Rank and Zacks Recommendation. Each provides valuable insights into the future profitability of the stock and can be used separately or in combination with each other depending on your investment style.
Zacks Recommendation
This rating system that has an excellent track record of predicting performance over the next 6 to 12 months. The foundation for the quantitatively determined Zacks Recommendation is trends in the company's estimate revisions and earnings outlook.
The Zacks Recommendation is broken down into 3 Levels; Outperform, Neutral and Underperform. Unlike most Wall Street firms, we have an excellent balance between the number of Outperform and Neutral recommendations.
Our team of 70 analysts are fully versed in the benefits of earnings estimate revisions and how that is harnessed through the Zacks quantitative rating system. But we have given our analysts the ability to override the Zacks Recommendation for the 1200 stocks that they follow. The reason for the analyst over-rides is that there are often factors such as valuation, industry conditions and management effectiveness that a trained investment professional can spot better than a quantitative model.
Zacks Rank
The Zacks Rank is our short-term rating system that is most effective over the one- to three-month holding horizon. The underlying driver for the quantitatively-determined Zacks Rank is the same as the Zacks Recommendation, and reflects trends in earnings estimate revisions.
| Value Score |
|
| Growth Score |
|
| Momentum Score |
|
| VGM Score |
|
Zacks Style Score Education
The Zacks Style Score is as a complementary indicator to the Zacks Rank, giving investors a way to focus on the best Zacks Rank stocks that best fit their own stock picking preferences.
Academic research has proven that stocks with the best Growth, Value, and Momentum characteristics outperform the market. The Zacks Style Scores rate stocks on each of these individual styles and assigns a rating of A, B, C, D and F. An A, is better than a B; a B is better than a C; and so on.
As an investor, you want to buy stocks with the highest probability of success. That means buying stocks with a Zacks Rank #1 or #2, Strong Buy or Buy, which also has a Style Score of an A or a B.
Disclosures
This report contains independent commentary to be used for informational purposes only. The analysts contributing to this report do not hold any shares of this stock. The analysts contributing to this report do not serve on the board of the company that issued this stock. The EPS and revenue forecasts are the Zacks Consensus estimates, unless otherwise indicated in the report’s first-page footnote. Additionally, the analysts contributing to this report certify that the views expressed herein accurately reflect the analysts' personal views as to the subject securities and issuers. ZIR certifies that no part of the analysts' compensation was, is, or will be, directly or indirectly, related to the specific recommendation or views expressed by the analyst in the report.
Additional information on the securities mentioned in this report is available upon request. This report is based on data obtained from sources we believe to be reliable, but is not guaranteed as to accuracy and does not purport to be complete. Any opinions expressed herein are subject to change.
ZIR is not an investment advisor and the report should not be construed as advice designed to meet the particular investment needs of any investor. Prior to making any investment decision, you are advised to consult with your broker, investment advisor, or other appropriate tax or financial professional to determine the suitability of any investment. This report and others like it are published regularly and not in response to episodic market activity or events affecting the securities industry.
This report is not to be construed as an offer or the solicitation of an offer to buy or sell the securities herein mentioned. ZIR or its officers, employees or customers may have a position long or short in the securities mentioned and buy or sell the securities from time to time. ZIR is not a broker-dealer. ZIR may enter into arms-length agreements with broker-dealers to provide this research to their clients. Zacks and its staff are not involved in investment banking activities for the stock issuer covered in this report.
ZIR uses the following rating system for the securities it covers. Outperform- ZIR expects that the subject company will outperform the broader U.S. equities markets over the next six to twelve months. Neutral- ZIR expects that the company will perform in line with the broader U.S. equities markets over the next six to twelve months. Underperform- ZIR expects the company will underperform the broader U.S. equities markets over the next six to twelve months.
No part of this report can be reprinted, republished or transmitted electronically without the prior written authorization of ZIR.