|
Feb 08, 2026 |
CNA Financial Corporation (NYSE: CNA)$49.83 USD ( As of 02/06/26 ) |
|
|||||||||||||
Data Overview
| 52 Week High-Low | $51.00 - $43.33 |
|---|---|
| 20 Day Average Volume | 333,002 |
| Beta | 0.37 |
| Market Cap | 13.49 B |
| Dividend / Div Yld | $1.84 / 3.69% |
| Industry | Insurance - Property and Casualty |
| Industry Rank | 143 / 243 (Bottom 41%) |
| Current Ratio | 0.28 |
| Debt/Capital | 20.78% |
| Net Margin | 6.71% |
| Price/Book (P/B) | 1.19 |
| Price/Cash Flow (P/CF) | 11.41 |
| Earnings Yield | 9.63% |
| Debt/Equity | 0.26 |
| Value Score | |
|---|---|
| P/E (F1) | 10.39 |
| P/E (F1) Rel to Industry | -2.98 |
| PEG Ratio | 4.81 |
| P/S (F1) | 0.91 |
| P/S (TTM) | 0.91 |
| P/CFO | 11.41 |
| P/CFO Rel to Industry | 0.37 |
| EV/EBITDA Annual | 11.34 |
| Growth Score | |
|---|---|
| Proj. EPS Growth (F1/F0) | -3.33% |
| Hist. EPS Growth (Q0/Q-1) | 8.37% |
| Qtr CFO Growth | 5.58 |
| 2 Yr CFO Growth | 6.63 |
| Return on Equity (ROE) | 12.78% |
| (NI - CFO) / Total Assets | NA |
| Asset Turnover | 0.22 |
| Momentum Score | |
|---|---|
| 1 week Volume change | 2.31% |
| 1 week Price Cng Rel to Industry | 4.86% |
| (F1) EPS Est 1 week change | 0.00% |
| (F1) EPS Est 4 week change | 0.00% |
| (F1) EPS Est 12 week change | 0.31% |
| (Q1) EPS Est 1 week change | 0.00% |
Summary
CNA Financial’s third-quarter 2017 earnings outperformed the Zacks Consensus Estimate but deteriorated year over year on significantly higher catastrophe losses. Being one of the versatile property and casualty (P&C) insurers, CNA Financial has been maintaining a good track record of combined ratio over the past few years, thereby leading to underwriting profitability. Moreover, with the rising interest rate environment, the company has been displaying improving investment results over a considerable period of time. The company also remains committed in enhancing shareholders value via effective capital deployment. Its long-term care business continues to perform strongly. However, exposure to catastrophe losses poses an inherent risk to the P&C business, thus rendering volatility to the company’s earnings. Also, shares of CNA Financial have underperformed the industry during the third quarter.
Elements of the Zacks Rank
Agreement Estimate Revisions (60 days)
|
100% Q1 (Current Qtr)Revisions: 1 Up: 1 Down: 0 |
0% Q2 (Next Qtr)Revisions: 0 Up: 0 Down: 0 |
100% F1 (Current Year)Revisions: 1 Up: 1 Down: 0 |
0% F2 (Next Year)Revisions: 0 Up: 0 Down: 0 |
Magnitude Consensus Estimate Trend (60 days)

|
||||||||||
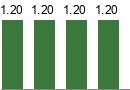
|
||||||||||
|
||||||||||

|
||||||||||
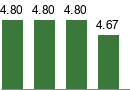
Upside Zacks Consensus Estimate vs. Most Accurate Estimate
|
|
|
|
|
Surprise Reported Earnings History
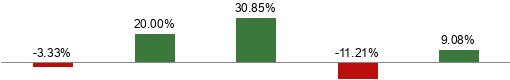
|
|
|
|
Average 4 Qtr Surprise |
||||||||||||||||||||||||
The data on the front page and all the charts in the report represent market data as of 02/06/26, while the report's text is as of 11/01/2017
Overview


Headquartered in Chicago, IL, CNA Financial Corporation was established in 1853. The company operates as a P&C insurer. It offers commercial P&C insurance products, mainly across the United States. Through its subsidiaries, the P&C insurer provides a wide range of insurance products, comprising property, marine and machinery coverage. Loews Corporation acts as the parent company, with 90% stake in its subsidiary, CNA Financial. The company’s P&C field structure consists of 49 underwriting locations across the United States.
CNA Financial classifies its operations through three core and two non-core segments. The three core segments are Specialty, Commercial and International. The two non-core segments are Life & Group Non-Core and Corporate & Other Non-Core.
Specialty (39% of 3Q17 Total operating revenues) – This segment offers management and professional liability and other coverage through P&C products and services. A network of brokers, independent agencies and managing general underwriters are utilized for this purpose.
Commercial (38%) – This particular segment has tied up with an independent agency distribution system and a network of brokers to market a wide range of P&C insurance products and services. These products and services will serve small, middle-market and large businesses and organizations.
International (10%) – The international segment of the company offers P&C insurance, as well as specialty coverage on a global basis. Such offerings are made available through its operations in Canada, the United Kingdom, Continental Europe and Singapore as well as through its presence at Lloyd’s of London.
Life & Group Non-Core (13%) – This segment mainly comprises of the results of the individual and group long-term care businesses that have been run off.

Reasons To Buy:
CNA Financial’s improving combined ratio reflects underwriting profitability, even amid a challenging operating environment. Solid capital and liquidity position continues to boost investors’ confidence on the stock.
Combined Ratio – CNA Financial has been witnessing substantial improvement in the combined ratio of its P&C business over the past few years. A company’s combined ratio reflects its underwriting profitability. Though CNA Financial has been witnessing deterioration in combined ratio over the last few quarters; the insurer has a history of maintaining the combined ratio at favorable levels — even in a tough operating environment —indicates its superior underwriting discipline. The company stated its third quarter underlying combined ratio of 94.6% also one of its best in the last ten years.
Long Term Care Business – CNA Financial remains focused on its ongoing efforts to continuously enhance and improve the management of the Long-Term Care business. The long-term care business has been making great progress to offer good service to policyholders, deliver improved claim outcomes efficiently, and achieve breakeven or even better financial results. The third-quarter results reflect a sustained performance of this business, which continues to perform slightly better than the breakeven level and displays efficient execution. Therefore, the company remains committed toward managing business risks, while improving the standard of policyholder service.
Improving Net Investment Income – After witnessing declining net investment income over the past few years owing to low interest rate environment, CNA Financial has been posting improved result from 2016. The momentum continued through the first nine months, with the same improving nearly 5%. The Federal Reserve’s announcement of interest rate hikes (0.25%) on Dec 16, 2016, another (1%) on Mar 15, 2017 and yet another (1.25%) on Jun 14, 2017, reflected the regulatory body’s confidence in the improving U.S. economy. With this rising interest rate environment, the insurer can look forward to improving the investment income in the near term.
Robust Capital Position - CNA Financial boasts a solid capital position, backed by a strong liquidity. The company remains confident about its liquidity position being robust enough to fund its current and expected working capital and debt obligation needs and does not expect this to change in the near term. Maintaining a robust capital and liquidity position shields the company from market volatility and enables it to retain the financial strength and flexibility needed to pursue new opportunities, consistent with its long-term strategy.
Its debt-to-capital ratio has also exhibited improvement over the last several years. Though the ratio deteriorated 50 bps in the third quarter, the same was below the 20-25% target. We expect to see improvement going forward, given the company’s strong cash balance, which is expected to meet debt burden and reduce debt levels. A low reliance on debt provides adequate financial flexibility to the company to manage its business and invest in its globally diversified platforms.
Strong Dividend History – Strong balance sheet and cash flows enable CNA Financial to engage in shareholder-friendly moves like dividend hikes. The company has increased dividends over the past few years. The company’s regular quarterly dividend payment has grown at a four-year CAGR (2012–2016) of 49.5%. Notably, 2016 marked another year of CNA Financial returning essentially 100% of the company’s earnings in dividends. In the second quarter, the company raised its quarterly dividend 20%, amounting to 30 cents per share. The current dividend yield of the company is 2.22%, much better than the sector yield of 1.93%. The insurer has also been paying special dividends since the past couple of years, the recent one being declared on Feb 2017 amounting to $2.00 per share. The company, thus, remains committed in returning more value to shareholders.
Reasons To Sell:
Catastrophe Loss exposure and escalating expenses raise concern.
Price Impact - Shares of CNA Financial have gained 3.1% during the third quarter, underperforming the industry’s increase of 5.9%. We expect higher catastrophe losses and escalating expenses to weigh on the company’s overall performance in the near term. While the company saw its 2017 estimates moving south over the last seven days, its 2018 estimate remained constant in the same time period.
Exposure to Catastrophe Losses – CNA Financial is a property and casualty (P&C) insurer and hence, remains exposed to catastrophe losses stemming from natural disasters and weather-related events. Such losses pose an inherent risk to the P&C insurance business and have contributed to the volatile results of the company. In the first nine months of 2017, the company reported a much higher level of catastrophe losses, mainly due to Hurricanes Harvey, Irma and Maria, and partly due to U.S. weather-related events. The company saw a whopping 150% increase in the catastrophe losses, which made a significant impact on the overall results. Therefore, exposure to cat loss remains a concern as natural disasters are unpredictable and affect results. However, losses were within company’s expectations.
Rising Expenses to Hurt Margin Expansion - CNA Financial has been witnessing rising expenses over the past few years, primarily due to increasing net incurred claims and benefits and amortization of deferred acquisition costs. Moreover, the company’s net operating income has been adversely affected by this increasing trend, which in turn, will hurt the overall profitability of the company. However, in 2016, the company witnessed a decline of 3.7% in expenses from 2015. Although in the first nine months of 2017, the metric saw an increase of 0.6%, we wait to see how the company fares in the near term. Moreover, the P&C insurer should strive to generate a higher revenue growth rate than the rise in expenses. Otherwise, expenses will tend to weigh on operating margin expansion.
Last Earnings Report
Quarter Ending 09/2025
| Report Date | Nov 03, 2025 |
|---|---|
| Sales Surprise | -0.07% |
| EPS Surprise | 20.00% |
| Quarterly EPS | 1.50 |
| Annual EPS (TTM) | 5.01 |
CNA Financial Q3 Earnings Beat Estimates, Plunge Y/Y
CNA Financial Corporation reported third-quarter 2017 operating income of 58 cents per share, beating the Zacks Consensus Estimate by 13.7%. However, the bottom line deteriorated 49.6% from the prior-year quarter.
The quarter witnessed significantly higher catastrophe losses, which impacted the overall company’s performance. Also, the company displayed lower net investment income in the reported quarter. Nonetheless, the company experienced improvement in its underlying combined ratio.
Including net realized investment gains, net income of 53 cents per share plummeted 57.9% year over year.
Behind Third-Quarter Headlines
Net investment income declined about 6.1% year over year to $308 million due to decrease in limited partnership returns in the quarter.
Net written premiums at Property & Casualty Operations slipped 1.5% year over year to $1.6 billion. Net operating income plunged about 49.2% year over year to $167 million due to substantially higher catastrophe losses in the reported quarter. However, improvement in non-catastrophe current accident year underwriting results partially offset the downside. Combined ratio deteriorated 1330 basis points (bps) on a year-over-year basis to 103.7%.
As of Sep 30, 2017, book value (excluding AOCI) was $44.48 per share, down 0.9% from Dec 31, 2016.
Segment Results
Specialty net written premiums fell 3.8% year over year to $705 million. Timing of certain renewals resulted in this downside. Retention was 89% in the reported quarter. Combined ratio deteriorated 240 bps to 82.3%.
Commercial net written premiums inched up 0.4% year over year to $687 million, driven by higher new business within Middle Markets. Retention came in at 85% in the quarter under review. Combined ratio deteriorated 1740 bps to 117.2%.
International net written premiums remained flat year over year at $207 million. Combined ratio deteriorated 3270 bps to 125.9%.
Life & Group Non-Core operating revenues rose 2.8% year over year to $331 million. Net operating income soared 66.7% year over year to $10 million.
Corporate & Other Non-Core net operating loss of $18 million was considerably narrower than a loss of $24 million in the year-ago quarter.
Dividend Update
The board of directors of CNA Financial announced a dividend of 30 cents per share during the reported quarter. The dividend will be paid on Nov 29 to stockholders of record as of Nov 13, 2017.
Recent News
CNA Partners with AON to Provide Dental Insurance - Aug 23, 2017
CNA Financial has entered into a partnership agreement with Aon Plc to offer insurance solutions to dental firms. This partnership, with nearly 100 years of experience in the dental malpractice insurance market, utilizes the marketing, distribution, underwriting, risk control and claims expertise of both organizations, to provide malpractice coverage which meets the evolving needs of dental practices.
Industry Analysis(1)Zacks Industry Rank: NA

Top Peers
| W.R. Berkley Corporation (WRB) |
|
| RenaissanceRe Holdings Ltd. (RNR) |
|
| Cincinnati Financial Corporation (CINF) |
|
| Arch Capital Group Ltd. (ACGL) |
|
| American Financial Group, Inc. (AFG) |
|
| The Hanover Insurance Group, Inc. (THG) |
|
| Axis Capital Holdings Limited (AXS) |
|
| First American Financial Corporation (FAF) |
|
| Mercury General Corporation (MCY) |
|
Industry Comparison Insurance - Property And Casualty | Position in Industry: 7 of 37 |
Industry Peers |
| CNA |
|
|---|---|
| Market Cap | 13.49 B |
| # of Analysts | 2 |
| Dividend Yield | 3.69% |
| Value Score | |
| Cash/Price | 0.20 |
| EV/EBITDA | 11.34 |
| PEG Ratio | 4.81 |
| Price/Book (P/B) | 1.19 |
| Price/Cash Flow (P/CF) | 11.41 |
| P/E (F1) | 10.39 |
| Price/Sales (P/S) | 0.91 |
| Earnings Yield | 9.63% |
| Debt/Equity | 0.26 |
| Cash Flow ($/share) | 4.37 |
| Growth Score | |
| Hist. EPS Growth (3-5 yrs) | 8.37% |
| Proj. EPS Growth (F1/F0) | -3.33% |
| Curr. Cash Flow Growth | 1.46% |
| Hist. Cash Flow Growth (3-5 yrs) | 4.31% |
| Current Ratio | 0.28 |
| Debt/Capital | 20.78% |
| Net Margin | 6.71% |
| Return on Equity | 12.78% |
| Sales/Assets | 0.22 |
| Proj. Sales Growth (F1/F0) | 2.03% |
| Momentum Score | |
| Daily Price Chg | 1.19% |
| 1 Week Price Chg | 4.86% |
| 4 Week Price Chg | 7.51% |
| 12 Week Price Chg | 7.60% |
| 52 Week Price Chg | 1.67% |
| 20 Day Average Volume | 333,002 |
| (F1) EPS Est Wkly Chg | 0.00% |
| (F1) EPS Est Mthly Chg | 0.00% |
| (F1) EPS Est Qtrly Chg | 0.31% |
| (Q1) EPS Est Mthly Chg | 0.00% |
| X Industry | S&P 500 |
|---|---|
| 5.27 B | 41.13 B |
| 3 | 22 |
| 0.51% | 1.34% |
| - | - |
| 0.13 | 0.04 |
| 8.45 | 15.24 |
| 1.79 | 2.01 |
| 1.65 | 3.76 |
| 12.44 | 15.57 |
| 10.71 | 19.27 |
| 1.32 | 3.16 |
| 9.34% | 5.16% |
| 0.14 | 0.57 |
| 4.63 | 9.04 |
| - | - |
| 19.10% | 7.79% |
| 2.59% | 9.21% |
| 15.00% | 6.96% |
| 11.62% | 7.76% |
| 0.50 | 1.19 |
| 12.09% | 37.83% |
| 12.10% | 12.75% |
| 16.58% | 17.16% |
| 0.34 | 0.53 |
| 4.83% | 5.26% |
| - | - |
| 0.00% | 1.97% |
| 3.25% | -0.10% |
| 1.61% | -0.49% |
| 1.03% | 2.94% |
| 14.06% | 15.04% |
| 205,035 | 3,105,239 |
| 0.00% | 0.00% |
| 0.00% | 0.00% |
| 0.14% | 0.32% |
| 0.00% | 0.00% |
| WRB | RNR | CINF |
|---|---|---|
| 26.76 B | 13.86 B | 26.94 B |
| 4 | 4 | 8 |
| 0.51% | 0.53% | 2.02% |
| 0.13 | 2.26 | 0.06 |
| 11.76 | -4.32 | 8.62 |
| 2.94 | 0.74 | 3.89 |
| 2.73 | 1.28 | 1.75 |
| 17.92 | 6.17 | 20.34 |
| 15.41 | 8.14 | 20.60 |
| 1.82 | 1.08 | 2.23 |
| 6.49% | 12.28% | 4.85% |
| 0.29 | 0.21 | 0.06 |
| 3.93 | 48.68 | 8.49 |
| 23.89% | 116.81% | 10.49% |
| 5.49% | -5.60% | 13.95% |
| 13.09% | 49.59% | 24.72% |
| 16.42% | 46.03% | 11.62% |
| 0.37 | 1.43 | 0.30 |
| 22.46% | 46.11% | 5.42% |
| 12.10% | 20.88% | 17.57% |
| 18.35% | 18.29% | 8.51% |
| 0.35 | 0.24 | 0.32 |
| 3.81% | 1.26% | 8.86% |
| 1.57% | 1.64% | 1.51% |
| 4.44% | 7.98% | 8.41% |
| 2.88% | 10.03% | 5.93% |
| -8.56% | 14.03% | 5.34% |
| 14.47% | 25.47% | 26.06% |
| 2,375,792 | 364,353 | 651,381 |
| -1.64% | -0.31% | 0.74% |
| -1.32% | 0.85% | 0.09% |
| -2.48% | 0.98% | 0.14% |
| -0.64% | -1.70% | 0.00% |
Zacks Stock Rating System
We offer two rating systems that take into account investors' holding horizons; Zacks Rank and Zacks Recommendation. Each provides valuable insights into the future profitability of the stock and can be used separately or in combination with each other depending on your investment style.
Zacks Recommendation
This rating system that has an excellent track record of predicting performance over the next 6 to 12 months. The foundation for the quantitatively determined Zacks Recommendation is trends in the company's estimate revisions and earnings outlook.
The Zacks Recommendation is broken down into 3 Levels; Outperform, Neutral and Underperform. Unlike most Wall Street firms, we have an excellent balance between the number of Outperform and Neutral recommendations.
Our team of 70 analysts are fully versed in the benefits of earnings estimate revisions and how that is harnessed through the Zacks quantitative rating system. But we have given our analysts the ability to override the Zacks Recommendation for the 1200 stocks that they follow. The reason for the analyst over-rides is that there are often factors such as valuation, industry conditions and management effectiveness that a trained investment professional can spot better than a quantitative model.
Zacks Rank
The Zacks Rank is our short-term rating system that is most effective over the one- to three-month holding horizon. The underlying driver for the quantitatively-determined Zacks Rank is the same as the Zacks Recommendation, and reflects trends in earnings estimate revisions.
| Value Score |
|
| Growth Score |
|
| Momentum Score |
|
| VGM Score |
|
Zacks Style Score Education
The Zacks Style Score is as a complementary indicator to the Zacks Rank, giving investors a way to focus on the best Zacks Rank stocks that best fit their own stock picking preferences.
Academic research has proven that stocks with the best Growth, Value, and Momentum characteristics outperform the market. The Zacks Style Scores rate stocks on each of these individual styles and assigns a rating of A, B, C, D and F. An A, is better than a B; a B is better than a C; and so on.
As an investor, you want to buy stocks with the highest probability of success. That means buying stocks with a Zacks Rank #1 or #2, Strong Buy or Buy, which also has a Style Score of an A or a B.
Disclosures
This report contains independent commentary to be used for informational purposes only. The analysts contributing to this report do not hold any shares of this stock. The analysts contributing to this report do not serve on the board of the company that issued this stock. The EPS and revenue forecasts are the Zacks Consensus estimates, unless otherwise indicated in the report’s first-page footnote. Additionally, the analysts contributing to this report certify that the views expressed herein accurately reflect the analysts' personal views as to the subject securities and issuers. ZIR certifies that no part of the analysts' compensation was, is, or will be, directly or indirectly, related to the specific recommendation or views expressed by the analyst in the report.
Additional information on the securities mentioned in this report is available upon request. This report is based on data obtained from sources we believe to be reliable, but is not guaranteed as to accuracy and does not purport to be complete. Any opinions expressed herein are subject to change.
ZIR is not an investment advisor and the report should not be construed as advice designed to meet the particular investment needs of any investor. Prior to making any investment decision, you are advised to consult with your broker, investment advisor, or other appropriate tax or financial professional to determine the suitability of any investment. This report and others like it are published regularly and not in response to episodic market activity or events affecting the securities industry.
This report is not to be construed as an offer or the solicitation of an offer to buy or sell the securities herein mentioned. ZIR or its officers, employees or customers may have a position long or short in the securities mentioned and buy or sell the securities from time to time. ZIR is not a broker-dealer. ZIR may enter into arms-length agreements with broker-dealers to provide this research to their clients. Zacks and its staff are not involved in investment banking activities for the stock issuer covered in this report.
ZIR uses the following rating system for the securities it covers. Outperform- ZIR expects that the subject company will outperform the broader U.S. equities markets over the next six to twelve months. Neutral- ZIR expects that the company will perform in line with the broader U.S. equities markets over the next six to twelve months. Underperform- ZIR expects the company will underperform the broader U.S. equities markets over the next six to twelve months.
No part of this report can be reprinted, republished or transmitted electronically without the prior written authorization of ZIR.