|
Aug 26, 2025 |
National Oilwell (NYSE: NOV)$13.16 USD ( As of 08/25/25 ) |
|
|||||||||||||
Data Overview
| 52 Week High-Low | $18.01 - $11.11 |
|---|---|
| 20 Day Average Volume | 4,003,905 |
| Beta | 1.32 |
| Market Cap | 4.86 B |
| Dividend / Div Yld | $0.30 / 2.29% |
| Industry | Oil and Gas - Mechanical and and Equipment |
| Industry Rank | 102 / 246 (Top 41%) |
| Current Ratio | 2.58 |
| Debt/Capital | 20.49% |
| Net Margin | 5.36% |
| Price/Book (P/B) | 0.74 |
| Price/Cash Flow (P/CF) | 5.21 |
| Earnings Yield | 7.79% |
| Debt/Equity | 0.26 |
| Value Score | |
|---|---|
| P/E (F1) | 12.89 |
| P/E (F1) Rel to Industry | -10.28 |
| PEG Ratio | 3.72 |
| P/S (F1) | 0.55 |
| P/S (TTM) | 0.55 |
| P/CFO | 5.21 |
| P/CFO Rel to Industry | 0.14 |
| EV/EBITDA Annual | 4.33 |
| Growth Score | |
|---|---|
| Proj. EPS Growth (F1/F0) | -36.49% |
| Hist. EPS Growth (Q0/Q-1) | 80.53% |
| Qtr CFO Growth | 25.35 |
| 2 Yr CFO Growth | 652.87 |
| Return on Equity (ROE) | 7.25% |
| (NI - CFO) / Total Assets | -1.16 |
| Asset Turnover | 0.77 |
| Momentum Score | |
|---|---|
| 1 week Volume change | -4.01% |
| 1 week Price Cng Rel to Industry | 7.64% |
| (F1) EPS Est 1 week change | -1.27% |
| (F1) EPS Est 4 week change | -10.14% |
| (F1) EPS Est 12 week change | -13.82% |
| (Q1) EPS Est 1 week change | -2.35% |
Summary
National Oilwell Varco is set to benefit from a series of acquisitions, which have expanded its directional drilling and diversified its completion tools offering. The GustoMSC acquisition has strengthened National Oilwell's hold in the offshore industry. It has experienced upturns in its Completions & Production Solutions order arrivals. In the most recent quarter, the oilfield equipment supplier’s order inflows totalled a healthy $502 million. However, a tough operating environment and weakness in commodity prices are likely to hamper the firms's performance in the coming quarters. Apart from the tightness in the upstream companies' investment budget due to weak crude prices, National Oilwell's recent pains could also be attributed to decline in onshore capital equipment sales. This accounts for our conservative stance.
Elements of the Zacks Rank
Agreement Estimate Revisions (60 days)
|
100% Q1 (Current Qtr)Revisions: 10 Up: 0 Down: 10 |
100% Q2 (Next Qtr)Revisions: 10 Up: 0 Down: 10 |
100% F1 (Current Year)Revisions: 11 Up: 0 Down: 11 |
90% F2 (Next Year)Revisions: 10 Up: 1 Down: 9 |
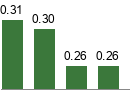
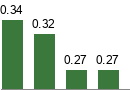
Magnitude Consensus Estimate Trend (60 days)
|
||||||||||
|
||||||||||
|
||||||||||
|
||||||||||
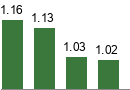
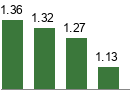
Upside Zacks Consensus Estimate vs. Most Accurate Estimate
|
|
|
|
|
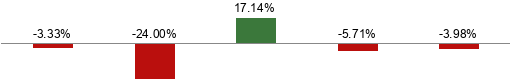
Surprise Reported Earnings History
|
|
|
|
Average 4 Qtr Surprise |
||||||||||||||||||||||||
The data on the front page and all the charts in the report represent market data as of 08/25/25, while the report's text is as of 08/26/2025
Overview


Incorporated in 1995, Houston, TX based National Oilwell Varco, Inc., formerly National Oilwell, is a world leader in the design, manufacture, and sale of comprehensive systems, components, products, and equipment used in oil and gas drilling and production worldwide. The company’s extensive portfolio of proprietary technologies is aimed at lowering the industry’s marginal cost per barrel.
National Oilwell Varco operates in 620 locations across six continents. For the year ended Dec 31, 2019, the company reported operating loss of $6,279 million on revenues of $8.48 billion. National Oilwell Varco generates around 45% of its revenues in North America.
.
The company reached its current form following the March 2005 merger between National Oilwell and Varco International. National Oilwell Varco divides its operations into three major segments: Rig Technologies, Completion & Production Solutions, and Wellbore Technologies.
Rig Technologies: The Rig Technologies unit (accounted for 30% of the company’s 2019 adjusted EBITDA) designs and manufactures integrated drilling systems and components for land and offshore drilling rigs. It is also engaged in the delivery of consumables, spares and other necessary services to maintain the usefulness of the assets.
Completion & Production Solutions: The Completion & Production Solutions segment (23%) primarily focuses on developing wellbore completions and achieving higher production though technological advancements. This segment mainly offers services to well intervention service providers and producers of oil and gas.
Wellbore Technologies: The Wellbore Technologies segment (47%) focuses on improving drilling performance at both land and offshore rigs through a vast array of tools and services.
National-Oilwell Varco has a solid track record of making and executing acquisitions. Over the last three years (2016-2018), the company paid approximately $600 million in cash to complete a host of acquisitions. Since its merger with Varco International, the company has emerged as a major one-stop-shop for the drilling industry, providing both capital equipment and support and supply services.

Reasons To Buy:
The company's joint venture with Saudi Aramco is also expected to support National Oilwell's drilling technology franchise and contribute to earnings.
The growing search for oil in deepwater frontiers has increased the demand for rigs capable of tackling the immense challenges of drilling in a mile or more of water. National Oilwell is well positioned to supply such equipment. Of late, the company has embarked on a series of acquisitions, which have expanded its directional drilling and diversified its completion tools offering. The acquisition of GustoMSC has strengthened national Oilwell's hold in the offshore industry. The company's joint venture with Saudi Aramco is also expected to support National Oilwell's drilling technology franchise and contribute to earnings.
National Oilwell has experienced upturns in its Completions & Production Solutions order arrivals. In the fourth quarter of 2019, the company’s order inflows totaled an impressive $502 million.
National Oilwell Varco is one of the biggest manufacturers of drilling equipment in the world with an impressive business model. The company’s large installed base of rigs worldwide provides a steady recurring revenue stream driven by demand for maintenance, parts and other expendable products. The company is also a global leader in solids control technology and waste management.
Moreover, the company's debt-to-capital ratio stands at 20.22%, which is much lower than most of its peers. The low leverage increase National Oilwell's financial flexibility, helping the company to tap various growth opportunities.
Reasons To Sell:
While National Oilwell's impressive portfolio of products and services is much appreciated, a tough operating environment and weakness in commodity prices are likely to hamper the company's performance in the coming quarters.
For operators in North America, where oil production has reached record levels, it’s more about the returns and not growth. The volatility in commodity price has convinced explorers and producers to take a relatively conservative approach on capital expenditure programs. This shift in customer strategy is likely to result in declining demand for National Oilwell's products and services. In particular, the company's Rig Technologies segment's recent results were impacted by lower capital equipment sales.
National Oilwell Varco's weaker-than-expected fourth earnings has been affected as North American drillers scale back their production growth plans, leaving less scope of work for the likes of National Oilwell Varco.
Following the acquisition of Denmark-based NKT Flexibles, National Oilwell Varco has become a top player in the lucrative floating production, storage and offloading (FPSO) market. However, the next few quarters are expected to be challenging in the FPSO space as low commodity prices have prompted clients to reassess the scope of such projects and look for ways to reduce costs.
Last Earnings Report
Quarter Ending 06/2025
| Report Date | Jul 28, 2025 |
|---|---|
| Sales Surprise | 1.85% |
| EPS Surprise | -3.33% |
| Quarterly EPS | 0.29 |
| Annual EPS (TTM) | 1.22 |
National Oilwell Q4 Earnings Lag, Revenues Beat Estimates
National Oilwell Varco, Inc. reported adjusted earnings of 13 cents per share in fourth-quarter 2019, missing the Zacks Consensus Estimate of 16 cents as North American drillers scale back their production growth plans, leaving less scope of work for the likes of National Oilwell Varco. However, the bottom line improved from the year-ago earnings of 3 cents. Particularly, better-than-expected revenue contribution from the Rig Technologies and the Wellbore Technologies segments led to this outperformance.
Rig Technologies’ revenues of $759 million surpassed the Zacks Consensus Estimate of $681 million owing to improved land rig deliveries and enhancement of offshore equipment projects.
Further, revenues from the Wellbore Technologies segment came in at $764 million, significantly above the Zacks Consensus Estimate of $746 million. The unit’s enhanced performance is attributable to recovery in the international and offshore market conditions and a better product mix.
Total revenues of $2.28 billion outperformed the Zacks Consensus Estimate of $2.10 billion but dipped 4.6% from the year-ago number of $2.39 billion.
Segmental Performance
Rig Technologies: Revenues summed $759 million compared with $804 million in the year-ago quarter, reflecting a 6% decrease, thanks to lower equipment sales. However, the unit’s adjusted EBITDA was $112 million, up 10% from $102 million in the year-earlier quarter. This gain is backed by the company’s cost-cutting initiatives.
Wellbore Technologies: Segmental revenues fell 14% year over year to $764 million as a result of reduced drilling operations in North America. Meanwhile, the unit’s adjusted EBITDA of $143 million decreased from the prior-year’s $155 million.
Completion & Production Solutions: Revenues at the segment were $799 million, up 1.4% from $788 million in the year-earlier quarter as offshore and international demand grew. The unit recorded adjusted EBITDA of $96 million, 14% lower than the year-ago figure of $112 million on steep decline in North American completion activities as customers continue to curtail spending.
Backlog
Capital equipment order backlog for Rig Technologies was $3 billion as of Dec 31, 2019 including $211 million worth of new orders.
Meanwhile, the Completion & Production Solutions’ backlog for capital equipment orders totalled $1.3 billion at the end of the fourth quarter. The figure included $502 million worth of new orders.
Balance Sheet
As of Dec 31, 2019, the company had cash and cash equivalents of $1.17 billion and long-term debt of $1.99 billion. The debt-to-capitalization ratio was 20.22%.
The Path Ahead
Although the domestic oil producers are unlikely to increase their spending anytime soon, the company sees a stronger offshore and aftermarket business. In response to the changing market dynamics, National Oilwell Varco will likely sustain its disciplined approach to capital spending and improvement in its efficiency level.
Industry Analysis(1)Zacks Industry Rank: NA

Top Peers
| National Energy Services Reunited (NESR) |
|
| Kodiak Gas Services, Inc. (KGS) |
|
| USA Compression Partners, LP (USAC) |
|
| North American Construction Group Ltd. (NOA) |
|
| Forum Energy Technologies, Inc. (FET) |
|
| Matrix Service Company (MTRX) |
|
| Oil States International, Inc. (OIS) |
|
| Innovex International, Inc. (INVX) |
|
| Solaris Energy Infrastructure, Inc. (SEI) |
|
Industry Comparison Oil And Gas - Mechanical And And Equipment | Position in Industry: 10 of 11 |
Industry Peers |
| NOV |
|
|---|---|
| Market Cap | 4.86 B |
| # of Analysts | 12 |
| Dividend Yield | 2.29% |
| Value Score | |
| Cash/Price | 0.22 |
| EV/EBITDA | 4.33 |
| PEG Ratio | 3.72 |
| Price/Book (P/B) | 0.74 |
| Price/Cash Flow (P/CF) | 5.21 |
| P/E (F1) | 12.89 |
| Price/Sales (P/S) | 0.55 |
| Earnings Yield | 7.79% |
| Debt/Equity | 0.26 |
| Cash Flow ($/share) | 2.51 |
| Growth Score | |
| Hist. EPS Growth (3-5 yrs) | 80.53% |
| Proj. EPS Growth (F1/F0) | -36.49% |
| Curr. Cash Flow Growth | 7.25% |
| Hist. Cash Flow Growth (3-5 yrs) | -24.05% |
| Current Ratio | 2.58 |
| Debt/Capital | 20.49% |
| Net Margin | 5.36% |
| Return on Equity | 7.25% |
| Sales/Assets | 0.77 |
| Proj. Sales Growth (F1/F0) | -3.24% |
| Momentum Score | |
| Daily Price Chg | 5.56% |
| 1 Week Price Chg | 7.64% |
| 4 Week Price Chg | -6.23% |
| 12 Week Price Chg | 9.17% |
| 52 Week Price Chg | -27.22% |
| 20 Day Average Volume | 4,003,905 |
| (F1) EPS Est Wkly Chg | -1.27% |
| (F1) EPS Est Mthly Chg | -10.14% |
| (F1) EPS Est Qtrly Chg | -13.82% |
| (Q1) EPS Est Mthly Chg | -13.63% |
| X Industry | S&P 500 |
|---|---|
| 332.43 M | 37.91 B |
| 2 | 22 |
| 0.00% | 1.49% |
| - | - |
| 0.16 | 0.04 |
| 4.15 | 14.41 |
| 3.47 | 2.36 |
| 1.05 | 3.60 |
| 5.66 | 14.92 |
| 17.23 | 20.18 |
| 0.71 | 3.09 |
| 5.80% | 4.94% |
| 0.11 | 0.58 |
| 2.51 | 8.99 |
| - | - |
| 52.31% | 9.13% |
| 24.63% | 7.85% |
| 10.01% | 6.75% |
| 7.46% | 7.23% |
| 2.01 | 1.21 |
| 17.69% | 38.33% |
| 5.57% | 12.37% |
| 7.66% | 17.03% |
| 0.71 | 0.53 |
| 1.61% | 5.03% |
| - | - |
| 1.41% | 1.52% |
| -0.22% | 0.27% |
| -0.56% | 1.23% |
| 4.48% | 9.39% |
| 11.53% | 14.77% |
| 149,090 | 2,720,468 |
| 0.00% | 0.00% |
| 0.00% | 0.29% |
| 0.32% | 0.86% |
| 0.00% | 0.00% |
| NESR | KGS | USAC |
|---|---|---|
| 834.32 M | 3.14 B | 2.99 B |
| 3 | 2 | 3 |
| 0.00% | 5.03% | 8.61% |
| 0.16 | 0.00 | 0.00 |
| 3.33 | 10.43 | 9.79 |
| NA | NA | NA |
| 0.89 | 2.35 | NA |
| 3.44 | 8.18 | 7.78 |
| 9.51 | 16.81 | 29.22 |
| 0.64 | 2.44 | 3.05 |
| 10.52% | 5.95% | 3.40% |
| 0.24 | 1.89 | -20.62 |
| 2.51 | 4.38 | 3.14 |
| NA | NA | NA |
| -13.33% | 280.36% | 24.63% |
| 25.35% | 95.42% | 12.76% |
| 9.58% | NA | 5.35% |
| 1.11 | 1.10 | 1.27 |
| 19.22% | 65.41% | 98.90% |
| 5.57% | 6.48% | 9.56% |
| 9.91% | 10.35% | -71.82% |
| 0.73 | 0.29 | 0.36 |
| 3.22% | 13.02% | 4.28% |
| 1.41% | -0.36% | 0.54% |
| 24.28% | 2.76% | 0.74% |
| 34.74% | 14.49% | -0.65% |
| 39.97% | 1.39% | -3.17% |
| -1.14% | 31.62% | 10.26% |
| 742,451 | 2,177,005 | 149,090 |
| -3.53% | 0.00% | 0.00% |
| -3.53% | 0.00% | 0.00% |
| -23.53% | 91.89% | -9.24% |
| -9.52% | 1.05% | 0.00% |
Zacks Stock Rating System
We offer two rating systems that take into account investors' holding horizons; Zacks Rank and Zacks Recommendation. Each provides valuable insights into the future profitability of the stock and can be used separately or in combination with each other depending on your investment style.
Zacks Recommendation
This rating system that has an excellent track record of predicting performance over the next 6 to 12 months. The foundation for the quantitatively determined Zacks Recommendation is trends in the company's estimate revisions and earnings outlook.
The Zacks Recommendation is broken down into 3 Levels; Outperform, Neutral and Underperform. Unlike most Wall Street firms, we have an excellent balance between the number of Outperform and Neutral recommendations.
Our team of 70 analysts are fully versed in the benefits of earnings estimate revisions and how that is harnessed through the Zacks quantitative rating system. But we have given our analysts the ability to override the Zacks Recommendation for the 1200 stocks that they follow. The reason for the analyst over-rides is that there are often factors such as valuation, industry conditions and management effectiveness that a trained investment professional can spot better than a quantitative model.
Zacks Rank
The Zacks Rank is our short-term rating system that is most effective over the one- to three-month holding horizon. The underlying driver for the quantitatively-determined Zacks Rank is the same as the Zacks Recommendation, and reflects trends in earnings estimate revisions.
| Value Score |
|
| Growth Score |
|
| Momentum Score |
|
| VGM Score |
|
Zacks Style Score Education
The Zacks Style Score is as a complementary indicator to the Zacks Rank, giving investors a way to focus on the best Zacks Rank stocks that best fit their own stock picking preferences.
Academic research has proven that stocks with the best Growth, Value, and Momentum characteristics outperform the market. The Zacks Style Scores rate stocks on each of these individual styles and assigns a rating of A, B, C, D and F. An A, is better than a B; a B is better than a C; and so on.
As an investor, you want to buy stocks with the highest probability of success. That means buying stocks with a Zacks Rank #1 or #2, Strong Buy or Buy, which also has a Style Score of an A or a B.
Disclosures
This report contains independent commentary to be used for informational purposes only. The analysts contributing to this report do not hold any shares of this stock. The analysts contributing to this report do not serve on the board of the company that issued this stock. The EPS and revenue forecasts are the Zacks Consensus estimates, unless otherwise indicated in the report’s first-page footnote. Additionally, the analysts contributing to this report certify that the views expressed herein accurately reflect the analysts' personal views as to the subject securities and issuers. ZIR certifies that no part of the analysts' compensation was, is, or will be, directly or indirectly, related to the specific recommendation or views expressed by the analyst in the report.
Additional information on the securities mentioned in this report is available upon request. This report is based on data obtained from sources we believe to be reliable, but is not guaranteed as to accuracy and does not purport to be complete. Any opinions expressed herein are subject to change.
ZIR is not an investment advisor and the report should not be construed as advice designed to meet the particular investment needs of any investor. Prior to making any investment decision, you are advised to consult with your broker, investment advisor, or other appropriate tax or financial professional to determine the suitability of any investment. This report and others like it are published regularly and not in response to episodic market activity or events affecting the securities industry.
This report is not to be construed as an offer or the solicitation of an offer to buy or sell the securities herein mentioned. ZIR or its officers, employees or customers may have a position long or short in the securities mentioned and buy or sell the securities from time to time. ZIR is not a broker-dealer. ZIR may enter into arms-length agreements with broker-dealers to provide this research to their clients. Zacks and its staff are not involved in investment banking activities for the stock issuer covered in this report.
ZIR uses the following rating system for the securities it covers. Outperform- ZIR expects that the subject company will outperform the broader U.S. equities markets over the next six to twelve months. Neutral- ZIR expects that the company will perform in line with the broader U.S. equities markets over the next six to twelve months. Underperform- ZIR expects the company will underperform the broader U.S. equities markets over the next six to twelve months.
No part of this report can be reprinted, republished or transmitted electronically without the prior written authorization of ZIR.