| © 2026 Zacks Investment Research, All Rights Reserved | 101 N Wacker Drive, Floor 15, Chicago, IL 60606 |
| Zacks Equity Research | www.zacks.com | Page $[page] of $[total] |
 |
Zacks Report Date: October 27, 2026 |

InterDigital, Inc. (IDCC)$324.26 (Stock Price as of 10/26/2026) Price Target (6-12 Months): $71.00 |
|
||||||||||||||||
Summary
InterDigital has to invest significantly in research and development to come up with innovative technology solutions, which in turn leads to escalated costs. It has been working to expand its revenue base through commercialization and licensing of technology projects, which further dent its margins. InterDigital’s policy of acquiring companies also adds to the integration risks, while intense competition from rivals is another headwind. However, its global footprint, diversified product portfolio and the ability to penetrate in different markets are noteworthy. The company is poised to gain from future growth opportunities, fueled by the 5G rollout. InterDigital’s commitment toward licensing its broad portfolio of technologies to wireless terminal equipment makers, which allows it to expand its core market capability, is also laudable.
Data Overview
| 52 Week High-Low | $412.60 - $249.14 |
|---|---|
| 20 Day Average Volume (sh) | 165,395 |
| Market Cap | $8.4 B |
| YTD Price Change | 1.9% |
| Beta | 1.43 |
| Dividend / Div Yld | $3.00 / 0.9% |
| Industry | Wireless Equipment |
| Zacks Industry Rank | Top 31% (76 out of 247) |
| Last EPS Surprise | 188.8% |
|---|---|
| Last Sales Surprise | 80.6% |
| EPS F1 Est- 4 week change | -1.4% |
| Expected Report Date | 10/29/2026 |
| Earnings ESP | 0.8% |
| P/E TTM | 27.3 |
|---|---|
| P/E F1 | 29.4 |
| PEG F1 | 2.0 |
| P/S TTM | 10.6 |
Price, Consensus & Surprise(1)

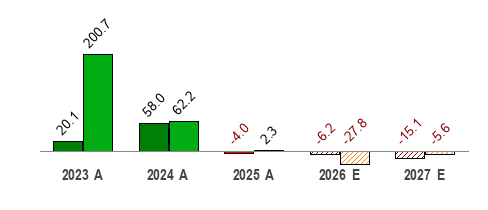
Sales and EPS Growth Rates (Y/Y %)(1)
Sales  |
EPS  |
Sales Estimates (millions of $)(1)
| Q1 | Q2 | Q3 | Q4 | Annual* | |
|---|---|---|---|---|---|
2027 |
164 E |
165 E |
167 E |
168 E |
664 E |
2026 |
205 A |
260 A |
157 E |
160 E |
782 E |
2025 |
211 A |
301 A |
165 A |
158 A |
834 A |
EPS Estimates(1)
| Q1 | Q2 | Q3 | Q4 | Annual* | |
|---|---|---|---|---|---|
2027 |
2.54 E |
2.55 E |
2.61 E |
2.74 E |
10.44 E |
2026 |
2.57 A |
4.62 A |
1.96 E |
1.88 E |
11.03 E |
2025 |
4.21 A |
6.52 A |
2.55 A |
2.12 A |
15.31 A |
*Quarterly figures may not add up to annual.
1) The data in the charts and tables, including the Zacks Consensus EPS and sales estimates, is as of 10/26/2026.
2) The report's text and the price target are as of 02/10/2021.
Overview


As of 10/26/2026
Headquartered in Wilmington, DE, InterDigital, Inc. is a pioneer in advanced mobile technologies that enables wireless communications and capabilities. The company engages in designing and developing a wide range of advanced technology solutions, which are used in digital cellular as well as wireless 3G, 4G and IEEE 802-related products and networks.
Furthermore, the company’s team of skilled engineers has an expertise in major mobile connectivity as well as in technologies related to content delivery. Notably, InterDigital’s secure and scalable horizontal platform, oneMPOWER, enables businesses to launch and manage Internet of Things (IoT) applications. The company also provides video encoding and transmission technologies while conducting fundamental research into video coding, IoT, smart home, imaging sciences, augmented reality and virtual reality, and artificial intelligence and machine learning technologies. The patented technologies of the company are used in several products like mobile devices, wireless infrastructure equipment as well as IoT devices and software platforms.
InterDigital derives revenues primarily from patent licensing, with contributions from patent sales, product sales, technology solutions licensing, and sales and engineering services. It has one of the most significant patent portfolios in the wireless and video industries. The company reports under a single operating segment.
The company has incorporated high quality video and artificial intelligence (AI) research team along with an established portfolio of video expertise to expand its footprint in wireless and video technologies and consumer electronics. InterDigital actively contributes to the technical development of standards pertaining to digital cellular and wireless communications and other technologies. Leveraging economies of scale and interoperability functions, these standards provide detailed specifications for wireless communications products and systems. Moreover, the standardization process benefits both implementers and consumers as it encourages the development of ideas and technical solutions that result in innovative standards.

As of 10/26/2026
Reasons To Buy:
InterDigital is optimizing its strength in core wireless licensing business and has taken concrete steps to drive shareholder value through the strategic buyout of Technicolor licensing business.
InterDigital aims to become a leading designer and developer of technology solutions and innovation for the mobile industry, IoT and allied technology areas by leveraging its research and development (R&D) capabilities, technological knowhow and rich industry experience. At the same time, the wireless R&D company intends to enhance its licensing revenue base by adding licensees and expanding into adjacent technology areas that align with its intellectual property position.
InterDigital’s commitment toward licensing its broad portfolio of technologies to wireless terminal equipment makers, which allows it to expand its core market capability, is laudable. The company has leading companies such as Huawei, Samsung, LG and Apple under its licensing agreement. InterDigital inked new license agreements including cellular-based licensing agreements with ZTE and Google and a video-based licensing agreement with Funai. Furthermore, InterDigital is eyeing annual licensing potential from new consumer electronics business at $150 million in three to five years. The combined revenue-generating potential of the wireless and consumer electronics licensing platforms has reached around $650 million.
InterDigital’s global footprint, diversified product portfolio and the ability to penetrate in different markets are impressive. Apart from the company’s strong portfolio of wireless technology solutions, the addition of technologies related to sensors, user interface and video to its offerings are likely to drive considerable value, considering the massive size of the market it licenses. Furthermore, the company remains committed to pursue strategic acquisitions in order to drive its product portfolio and boost organic growth.
InterDigital is optimizing its strength in core wireless licensing business and has taken steps to drive shareholder value through the buyout of Technicolor licensing business. This has created significant new licensing opportunity in the video and consumer electronics markets. It has also acquired the Research & Innovation unit of Technicolor SA, a technology leader in the media and entertainment sector. The company is poised to gain from future growth opportunities, fueled by the 5G rollout. Such strategic acquisitions are anticipated to be accretive to InterDigital’s financials and contribute to its long-term growth.
As of Sep 30, 2020, InterDigital had $919.4 million in cash and equivalents with $411.8 million of long-term debt compared with the respective tallies of $839 million and $359 million at the end of the previous quarter. The company currently has a debt-to-capital ratio of 0.31. The times interest earned (TIE) ratio has improved over the past quarters to 2.3 at present. This indicates that the company is likely to meet its debt obligations. It has a dividend payout rate of 105.3%. It is to be seen whether InterDigital can maintain the momentum in the coming days amid disruptions stemming from the COVID-19 crisis.
Reasons To Sell:
Decline in return on capital despite a rise in InterDigital’s capital spending and capitalized patent cost is worrisome. High research and development cost further reduce the company’s profitability.
InterDigital has been working to expand its revenue base through continuous development, commercialization and licensing of technology projects, which in turn tend to put pressure on margins. The company faces substantial competitive pressure and thus needs to constantly work on product quality and customer service. Also, in order to hedge the competitive pressure, InterDigital has to invest significantly in R&D to come up with innovative technology solutions, which in turn leads to escalated costs. InterDigital’s policy of acquiring companies further adds to the integration risks.
InterDigital’s return on total capital has decreased at a CAGR of 35% from 2012 to 2019. The decline in return on capital despite a rise in the company’s capital spending and capitalized patent cost is a concern. This apart, InterDigital’s return on equity has also witnessed a negative CAGR of 35.7% over the same timeframe, indicating its inability to generate profit to reward shareholders with attractive risk-adjusted returns.
The uncertain macroeconomic environment due to the pandemic has led to a loss of business for InterDigital. Moreover, latent tensions between the United States and China owing to trade restrictions imposed on the sale of communication equipment and technology solutions to Chinese firms are expected to hurt the industry's credibility. The Zacks Consensus Estimate for the company’s next-year earnings has been revised 0.5% downward over the past 30 days.
Last Earnings Report
FY Quarter Ending |
9/30/2026 |
|---|
| Earnings Reporting Date | Jul 30, 2026 |
|---|---|
| Sales Surprise | 80.64% |
| EPS Surprise | 188.75% |
| Quarterly EPS | 4.62 |
| Annual EPS (TTM) | 11.86 |
InterDigital Q3 Earnings Beat on Top-Line Growth
Despite the coronavirus-induced adversities, InterDigital reported solid third-quarter 2020 results, wherein both top and bottom lines surpassed the respective Zacks Consensus Estimate. Higher revenues generated from new licensing avenues highlighted the operating leverage of the company’s business model and reflected the strength of its licensing business.
Net Income
The company reported net income of $23.8 million or 76 cents per share compared with $2.2 million or 7 cents per share in the year-ago quarter. The stellar year-over-year increase in earnings was largely attributable to top-line growth. Adjusted earnings for the reported quarter were 17 cents per share, which surpassed the consensus mark by 3 cents.
Revenues
The wireless R&D company’s revenues totaled $87.5 million, up from $72.5 million in the year-earlier quarter. The top line surpassed the Zacks Consensus Estimate of $85 million. The healthy double-digit growth amid the challenging macroeconomic environment was primarily driven by the new fixed-fee patent license agreement signed over the trailing 12-month period with China-based telecom equipment manufacturers, Huawei and ZTE.
Recurring revenues during the reported quarter were $87 million compared with $72.1 million a year ago. While total revenues from patent royalties came in at $85.2 million, the same from current technology solutions aggregated $2.3 million.
Other Details
Total operating expenses were $72.1 million, up from $68.7 million in the prior-year quarter due to intellectual property enforcement and non-patent litigation costs with Lenovo and Xiaomi. Operating income was $15.4 million compared with $3.8 million a year ago, buoyed by higher revenues in the reported quarter.
Cash Flow and Liquidity
In the first nine months of 2020, InterDigital generated $144.2 million of cash from operating activities compared with $72 million in the year-ago period. Free cash flow in the first nine months of 2020 was $110.6 million, up from $42.8 million in the prior-year period. As of Sep 30, 2020, the company had $919.4 million in cash and short-term investments along with $411.8 million of long-term debt and other liabilities.
Outlook
Banking on solid licensing agreements with leading consumer electronics customers, InterDigital is eyeing a healthy licensing business despite the coronavirus-induced pandemonium. The company is relatively immune to the adverse economic effects of the virus outbreak as fixed priced agreements make up for more than 90% of revenues. InterDigital also remains poised to gain from growth opportunities from 5G rollout.
Recent News
On Jan 11, 2021, InterDigital announced the election of Ed Ehrlich as the Wireless Technologies and Systems Committee Radio Access Network chair within ATIS, the North American operating partner of the 3GPP.
On Dec 17, 2020, InterDigital announced the completion of Video-based Point Cloud Compression (V-PCC) and Versatile Video Coding (VVC) standards. These two standards are best known for providing enhanced video quality with an immersive experience. The V-PCC standard compresses high-bandwidth content for a more engaging experience within the video ecosystem while the VVC standard improves high-efficiency video coding performance by 50%.
On Dec 16, 2020, InterDigital announced revenue guidance for fourth-quarter 2020. Despite various macroeconomic challenges stemming from the pandemic, it anticipates revenues to be in the range of $84-$88 million, which includes $1-$2 million in non-recurring revenues.
Valuation
InterDigital’s shares are up 17.4% in the trailing 12-month period and up 3.3% in the past six months. Stocks in the Zacks sub-industry are up 41.6% in the past year and up 26.5% in the past six months. Stocks in the Zacks Computer and Technology sector are up 42% in the past year and up 30.1% in the past six months.
The S&P 500 Index is up 18.6% in the past year and up 18.9% in the past six months.
The stock is currently trading at 10.35X trailing 12-month EV/EBITDA, which compares to 27.8X for the Zacks sub-industry, 17.71X for the Zacks sector and 16.76X for the S&P 500 Index.
Over the past five years, the stock has traded as high as 17.69X and as low as 3.19X, with a 5-year median of 6.41X. Our Neutral recommendation indicates that the stock will perform in line with the market. Our $71 price target reflects 2.17X forward 12-month earnings.
The table below shows summary valuation data for IDCC

Industry Analysis(1)Zacks Industry Rank: Top 31% (76 out of 247)

Top Peers(1)
| Company (Ticker) | Rec | Rank |
| Ubiquiti Inc. (UI) | Outperform |  |
| AST SpaceMobile, Inc. (ASTS) | Neutral |  |
| Comtech Telecommunications Corp. (CMTL) | Neutral | |
| Ericsson (ERIC) | Neutral | |
| Nokia Corporation (NOK) | Neutral |  |
| Aviat Networks, Inc. (AVNW) | Underperform |  |
| Clearfield, Inc. (CLFD) | Underperform | |
| QUALCOMM Incorporated (QCOM) | Underperform |  |
Industry Comparison(1)Industry: Wireless Equipment |
Industry Peers |
| IDCC | |
|---|---|
| Zacks Recommendation (Long Term) | Neutral |
| Zacks Rank (Short Term) | |
| VGM Score |  |
| Market Cap | $8.37 B |
| # of Analysts | 2 |
| Dividend Yield | 0.93% |
| Value Score |  |
| Cash/Price | 0.13 |
| EV/EBITDA | 12.38 |
| PEG Ratio | 1.96 |
| Price/Book (P/B) | 6.96 |
| Price/Cash Flow (P/CF) | 16.26 |
| P/E (F1) | 29.40 |
| Price/Sales (P/S) | 10.61 |
| Earnings Yield | 3.40% |
| Debt/Equity | 0.01 |
| Cash Flow ($/share) | 19.94 |
| Growth Score |  |
| Hist. EPS Growth (3-5 yrs) | 62.16% |
| Proj. EPS Growth (F1/F0) | -27.96% |
| Curr. Cash Flow Growth | 14.81% |
| Hist. Cash Flow Growth (3-5 yrs) | 32.47% |
| Current Ratio | 1.74 |
| Debt/Capital | 0.90% |
| Net Margin | 38.32% |
| Return on Equity | 28.17% |
| Sales/Assets | 0.37 |
| Proj. Sales Growth (F1/F0) | -6.20% |
| Momentum Score |  |
| Daily Price Chg | -0.92% |
| 1 Week Price Chg | 2.50% |
| 4 Week Price Chg | -0.88% |
| 12 Week Price Chg | 4.86% |
| 52 Week Price Chg | -16.18% |
| 20 Day Average Volume | 165,395 |
| (F1) EPS Est 1 week change | -0.37% |
| (F1) EPS Est 4 week change | -1.37% |
| (F1) EPS Est 12 week change | 26.65% |
| (Q1) EPS Est Mthly Chg | -5.79% |
| X Industry | S&P 500 |
|---|---|
| - | - |
| - | - |
| - | - |
| 830.28 M | 44.84 B |
| 3 | 23 |
| 0.00% | 1.35% |
| - | - |
| 0.20 | 0.04 |
| 9.96 | 14.62 |
| 1.89 | 1.85 |
| 2.04 | 3.66 |
| 15.70 | 15.12 |
| 28.43 | 18.66 |
| 2.86 | 3.12 |
| 2.76% | 5.33% |
| 0.04 | 0.55 |
| 0.77 | 9.67 |
| - | - |
| -2.53% | 7.14% |
| 14.30% | 12.84% |
| -3.88% | 8.27% |
| 9.90% | 9.07% |
| 1.74 | 1.18 |
| 8.04% | 37.14% |
| 2.19% | 13.17% |
| 9.55% | 18.01% |
| 0.55 | 0.55 |
| 4.93% | 7.66% |
| - | - |
| 0.39% | 0.70% |
| 0.52% | -0.18% |
| -6.62% | -0.09% |
| -12.26% | 1.00% |
| -11.03% | 11.66% |
| 148,631 | 2,893,202 |
| 0.00% | 0.00% |
| 0.00% | 0.02% |
| 0.91% | 0.69% |
| 0.00% | 0.00% |
| AVNW |
|---|
| Underperform |
|
 |
| 252.93 M |
| 4 |
| 0.00% |
 |
| 0.30 |
| 9.96 |
| NA |
| 0.95 |
| 11.84 |
| 7.65 |
| 0.58 |
| 13.07% |
| 0.33 |
| 1.66 |
|
| -14.92% |
| 54.82% |
| -3.88% |
| -7.55% |
| 1.97 |
| 24.99% |
| 0.58% |
| 5.85% |
| 0.70 |
| 5.70% |
 |
| 2.61% |
| 1.21% |
| -0.71% |
| -3.81% |
| -18.14% |
| 102,066 |
| 0.00% |
| 0.00% |
| -14.43% |
| 0.00% |
Zacks Stock Rating System
We offer two rating systems that take into account investors' holding horizons: Zacks Rank and Zacks Recommendation. Each provides valuable insights into the future profitability of the stock and can be used separately or in combination with each other depending on your investment style.
Zacks Recommendation
The Zacks Recommendation aims to predict performance over the next 6 to 12 months. The foundation for the quantitatively determined Zacks Recommendation is trends in the company's estimate revisions and earnings outlook. The Zacks Recommendation is broken down into 3 Levels; Outperform, Neutral and Underperform. Unlike many Wall Street firms, we have an excellent balance between the number of Outperform and Neutral recommendations. Our team of 70 analysts are fully versed in the benefits of earnings estimate revisions and how that is harnessed through the Zacks quantitative rating system. But we have given our analysts the ability to override the Zacks Recommendation for the 1200 stocks that they follow. The reason for the analyst over-rides is that there are often factors such as valuation, industry conditions and management effectiveness that a trained investment professional can spot better than a quantitative model.
Zacks Rank
The Zacks Rank is our short-term rating system that is most effective over the one- to three-month holding horizon. The underlying driver for the quantitatively-determined Zacks Rank is the same as the Zacks Recommendation, and reflects trends in earnings estimate revisions.
Zacks Style Scores
| Value Score |
|
| Growth Score |
|
| Momentum Score |
|
| VGM Score |
|
The Zacks Style Score is as a complementary indicator to the Zacks rating system, giving investors a way to focus on the highest rated stocks that best fit their own stock picking preferences.
Academic research has proven that stocks with the best Value, Growth and Momentum characteristics outperform the market. The Zacks Style Scores rate stocks on each of these individual styles and assigns a rating of A, B, C, D and F. We also produce the VGM Score (V for Value, G for Growth and M for Momentum), which combines the weighted average of the individual Style Scores into one score. This is perfectly suited for those who want their stocks to have the best scores across the board.
As an investor, you want to buy stocks with the highest probability of success. That means buying stocks with a Zacks Recommendation of Outperform, which also has a Style Score of an A or a B.
Disclosures
This report contains independent commentary to be used for informational purposes only. The analysts contributing to this report do not hold any shares of this stock. The analysts contributing to this report do not serve on the board of the company that issued this stock. The EPS and revenue forecasts are the Zacks Consensus estimates, unless otherwise indicated in the report’s first-page footnote. Additionally, the analysts contributing to this report certify that the views expressed herein accurately reflect the analysts' personal views as to the subject securities and issuers. ZIR certifies that no part of the analysts' compensation was, is, or will be, directly or indirectly, related to the specific recommendation or views expressed by the analyst in the report.
Additional information on the securities mentioned in this report is available upon request. This report is based on data obtained from sources we believe to be reliable, but is not guaranteed as to accuracy and does not purport to be complete. Any opinions expressed herein are subject to change.
ZIR is not an investment advisor and the report should not be construed as advice designed to meet the particular investment needs of any investor. Prior to making any investment decision, you are advised to consult with your broker, investment advisor, or other appropriate tax or financial professional to determine the suitability of any investment. This report and others like it are published regularly and not in response to episodic market activity or events affecting the securities industry.
This report is not to be construed as an offer or the solicitation of an offer to buy or sell the securities herein mentioned. ZIR or its officers, employees or customers may have a position long or short in the securities mentioned and buy or sell the securities from time to time. ZIR is not a broker-dealer. ZIR may enter into arms-length agreements with broker-dealers to provide this research to their clients. Zacks and its staff are not involved in investment banking activities for the stock issuer covered in this report.
ZIR uses the following rating system for the securities it covers. Outperform- ZIR expects that the subject company will outperform the broader U.S. equities markets over the next six to twelve months. Neutral- ZIR expects that the company will perform in line with the broader U.S. equities markets over the next six to twelve months. Underperform- ZIR expects the company will underperform the broader U.S. equities markets over the next six to twelve months.
No part of this report can be reprinted, republished or transmitted electronically without the prior written authorization of ZIR.