| © 2026 Zacks Investment Research, All Rights Reserved | 101 N Wacker Drive, Floor 15, Chicago, IL 60606 |
| Zacks Equity Research | www.zacks.com | Page $[page] of $[total] |
|
Zacks Report Date: March 15, 2026 |
Logitech International (LOGI)$92.75 (Stock Price as of 03/13/2026) Price Target (6-12 Months): $99.00 |
|
||||||||||||||||
Summary
Logitech’s stronger-than-expected results for the second quarter of fiscal 2024 have boosted confidence about its recovery from the post-pandemic downturn. Heightening hybrid work trends are likely to boost demand for the company’s video collaboration, keyboards & combos and pointing device tools. Thriving cloud-based video conferencing services continue to be the key catalyst. The rising adoption of new mobile platforms in both mature and emerging markets will fuel demand for its peripherals and accessories. Its partnerships with cloud providers like Zoom Video, Microsoft and Google are major positives. However, softening IT spending amid the current macroeconomic and geopolitical issues might hurt the company’s performance in the near term. Our estimates suggest Logitech’s FY24 revenues to decline 9.1% year over year.
Data Overview
| 52 Week High-Low | $123.01 - $64.73 |
|---|---|
| 20 Day Average Volume (sh) | 865,882 |
| Market Cap | $13.6 B |
| YTD Price Change | -7.5% |
| Beta | 1.09 |
| Dividend / Div Yld | $0.00 / 0.0% |
| Industry | Computer - Peripheral Equipment |
| Zacks Industry Rank | Bottom 11% (216 out of 243) |
| Last EPS Surprise | 7.8% |
|---|---|
| Last Sales Surprise | 0.9% |
| EPS F1 Est- 4 week change | 0.0% |
| Expected Report Date | 05/05/2026 |
| Earnings ESP | 0.0% |
| P/E TTM | 16.7 |
|---|---|
| P/E F1 | 28.2 |
| PEG F1 | 3.8 |
| P/S TTM | 2.9 |
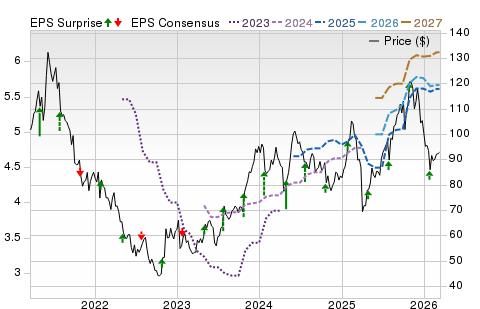
Price, Consensus & Surprise(1)
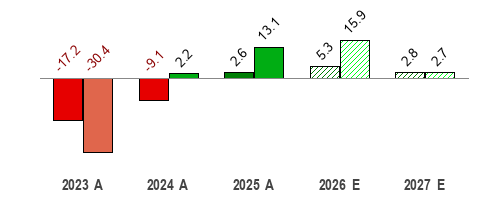
Sales and EPS Growth Rates (Y/Y %)(2)
Sales  |
EPS  |
Sales Estimates (millions of $)(2)
| Q1 | Q2 | Q3 | Q4 | Annual* | |
|---|---|---|---|---|---|
2027 |
|||||
2026 |
|||||
2025 |
1,088 A |
1,116 A |
1,340 A |
1,010 A |
4,555 A |
EPS Estimates(2)
| Q1 | Q2 | Q3 | Q4 | Annual* | |
|---|---|---|---|---|---|
2027 |
|||||
2026 |
|||||
2025 |
1.13 A |
1.20 A |
1.59 A |
0.93 A |
4.84 A |
*Quarterly figures may not add up to annual.
1) The data in the charts and tables, except the estimates, is as of 03/13/2026.
2) The report's text, the analyst-provided estimates, and the price target are as of 12/06/2023.
Overview


As of 12/06/2023
Based in Switzerland, Logitech International S.A. is the parent holding company of Logitech. The company is a global leader in peripherals for personal computers and other digital platforms. It develops and markets innovative products in PC navigation, Internet communications, digital music, home-entertainment control, video security, interactive gaming and wireless devices.
The company conducts its business through subsidiaries located throughout the world. Logitech's brands include Logitech, Logitech G, ASTRO Gaming, Streamlabs, Ultimate Ears, Jaybird, and Blue Microphones.
Logitech operate in a single operating segment, Peripherals, which consists of the design, manufacturing and marketing of peripherals for PCs and other digital platforms. For the PC, the company’s products include trackballs, interactive gaming controllers, multimedia speakers, headsets, webcams, 3D control devices and lapdesks. Tablet & Other Accessories products include keyboard and covers.
Internet communications products comprise webcams, headsets, video communications services and digital video security systems for a home or small business.
Mobile Speakers products include wireless speakers, earphones and custom in-ear monitors. For home entertainment systems, Logitech offers the Harmony line of advanced remote controls and Squeezebox wireless music solutions.
In fiscal 2023, Logitech reported net sales of $4.54 billion. Americas, Europe, Middle East and Africa (EMEA) and Asia Pacific accounted for 43.0%, 28.0% and 29% of net sales, respectively.
Moreover, in terms of principal markets, Switzerland, the United States and Germany represented 3%, 34% and 15% of sales in fiscal 2022.
Major distributors in North America include Ingram Micro, TD SYNNEX and D&H Distributing Company. Major pan-European distributors include Ingram Micro, Tech Data, ALSO Group and DCC PLC. In Asia, apart from Ingram Micro, other major distributors include Wincheers International Trading and Beijing Digital China Limited in China, Daiwabo in Japan, and Synnex in Australia.

As of 03/13/2026
Reasons To Buy:
The bullish momentum in Gaming and Video Collaboration businesses, along with the thriving cloud-based video conferencing services, will continue to be catalysts for the company’s growth.
Growing adoption of new mobile platforms in both mature and emerging markets are fueling the demand for Logitech’s peripherals and accessories. Robust sales across product categories and strong momentum in Video Collaboration, Keyboards & Combos and Pointing Devices businesses, are key catalyst. Logitech has been able to leverage its software and go-to-market capabilities to drive market share gains and growth. The company’s cloud-based video conferencing services is also a key growth driver. Apart from this, growth in its tablet business has proved conducive to its top-line.
Logitech is intending to tap the high potential market for accessories by pursuing innovation and expanding its product lines. The company has manufactured innovative offerings like fastest performing mouse and keyboard switches, wireless mouse with longest battery, and multi-device keyboards among others. Over the last few years, Logitech has introduced a number of offerings to grab a greater market share. This apart, the acquisition of earbud manufacturer Jaybird has helped Logitech expand its current product portfolio to address customers who prefer headphones over speakers. With such a strong product roster and excellent demand, Logitech is optimistic about the market traction of its offerings in coming times.
The acquisition of Finland’s Loupedeck in July 2023 will enhance Logitech’s ability to provide customizable and contextual control experiences for the company’s full portfolio of devices, including Logitech Software Roadmap solution. Loupedeck offers deep native integrations with industry-leading creative software for photo editing, retouching, video editing, color grading design and streaming. Its custom consoles combine analog control with digital precision to offer power and flexibility to all creators. With this buyout, Logitech will leverage Loupedeck’s strong and growing developer community that will unveil advanced innovation, empowering streamers, creators and gamers.
Logitech has a strong balance sheet with ample liquidity position and no debt obligations. Cash and cash equivalents were $1.16 billion as of Sep 30, 2023. Since it carries no long-term debt, the cash is available for pursuing strategic acquisitions, investment in growth initiatives and distribution to shareholders.
Logitech generates solid cash flow, which allows management the opportunity to invest in product innovations, acquisitions and business development. At the same time, the company has historically returned significant cash through a combination of share repurchases and dividend to reward shareholders with risk-adjusted returns. The company generated cash flow from operations of $534 million in the fiscal 2023. The company’s solid cash flow generating ability is expected to help it enhance shareholders’ wealth through dividend payments and share repurchases. In fiscal 2023, it bought back shares worth $418 million and paid $159 million in dividend. Furthermore, in the first half of fiscal 2024, the company generated $463.1 million in cash flow from operating activities and repurchased shares worth $188.9 million.
Risks
- Logitech’s near-term performance is likely to be gloomy as the demand for computer peripherals and accessories have softened due to the reopening of economies and offices. Logitech registered a sales decline across all product categories in the last reported quarter except for Pointing Devices and Tablet & Accessories. Moreover, softening IT spending amid the current macroeconomic and geopolitical issues might hurt Logitech’s near-term performance. Our estimates suggest Logitech’s fiscal 2024 revenues to decline 9.1% year over year.
- The rising trend of smaller, mobile computing devices with touch interfaces and the declining popularity of desktop PCs can be a headwind for the company. Moreover, the company’s sales are impacted by end-user consumer demand and therefore, the business can be negatively impacted by unanticipated shifts in consumer buying patterns.
- The market where Logitech operates is highly competitive and characterized by short product life cycles, constant new product introductions, rapidly changing technology, evolving customer demands and aggressive promotional and pricing practices. Strong competitors like Microsoft, Bose, Philips and Cisco Systems as well as increasing new entrants in Logitech’s operating markets pose a threat. Therefore, in a dynamic market such as this, Logitech needs to bring in newer products that match the trend, in order to survive the competition. Consequently, the company has been experiencing significant surges in R&D expenses, which is likely to remain an overhang on the upcoming quarters.
- Logitech’s business is prone to be affected by the negative impact of currency translation as the company derives highest portion of its revenues from outside the Americas. Adverse currency impact also significantly hurt the company’s operating cash flow. Apart from currency fluctuations, weaknesses in political and macroeconomic conditions are adding to the company’s woes. In particular, geopolitical tensions between Russia and Ukraine are posing risks for Logitech. Such external factors create unpredictability and are beyond the control of the company.
Last Earnings Report
FY Quarter Ending |
3/31/2025 |
|---|
| Earnings Reporting Date | Jan 27, 2026 |
|---|---|
| Sales Surprise | 0.86% |
| EPS Surprise | 7.82% |
| Quarterly EPS | 1.93 |
| Annual EPS (TTM) | 5.57 |
Logitech's Q2 Earnings and Revenues Surpass Estimates
Logitech reported better-than-expected results in the second quarter of fiscal 2024. The computer peripheral and software maker’s fiscal second-quarter non-GAAP earnings of $1.09 per share beat the Zacks Consensus Estimate of 66 cents per share and registered a year-over-year increase of 30%.
The company revealed that its second-quarter profits exceeded the pre-pandemic level, mainly driven by improved component costs and reduced operating expenses. However, lower revenues partially offset the positive impacts of the aforementioned factors.
Logitech’s fiscal second-quarter revenues of $1.06 billion marked a year-over-year decline of 8% on a reported basis and 9% on a constant-currency basis. However, the top line outpaced the consensus mark of $978.4 million.
In 2020 and 2021, LOGI benefited from the elevated demand for its video collaboration, keyboards & combos and pointing device tools, mainly driven by the heightening of work-from-home and learn-from-home trends. Additionally, the demand for gaming products shot up due to the growing popularity of online video games and eSports amid the stay-at-home scenario. However, the demand softened due to the reopening of economic and business activities later on.
Segment Details
Logitech registered a sales decline across the majority of key product categories year over year except for Pointing Devices and Tablet Accessories.
Revenues from Pointing Devices improved 3% year over year to $192 million, while Tablet Accessories revenues increased 17% year over year to $64 million. According to our model estimates, Pointing Devices sales were likely to decline 11.1% to $164.6 million, while revenues from Tablet Accessories were expected to increase 13.8% to $61.7 million.
Keyboards & Combos’ sales fell 3% to $195 million. Sales from Webcams were down 14% to $88 million, while Gaming sales plunged 12% to $282 million. Our estimates for Logitech’s Keyboards & Combos, Webcams and Gaming second-quarter revenues were pegged at $173.7 million, $76.4 million and $259 million, respectively. These estimates depicted a year-over-year decline of 13.5%, 25.1% and 19.6%, respectively.
Revenues from Video Collaboration also plunged 15% to $152 million. Our estimates for the segment were pegged at $141 million, suggesting a 21.2% decline.
In the first quarter of fiscal 2024, Logitech reclassified its product segments by removing the Audio & Wearable and Mobile Speakers categories and adding Headsets and Other categories. While the Headsets segment’s sales declined 1% year over year to $44 million in the second quarter, the Other segment’s sales plunged 35% year over year to $40 million.
Margins & Operating Metrics
The non-GAAP gross profit improved to $444 million from $443 million in the year-ago quarter. The non-GAAP gross margin expanded 340 basis points from the prior-year quarter to 42%. The year-over-year increase was driven by cost improvement, lower promotions and less reliance on expedited shipping, partially offset by an unfavorable product mix.
Non-GAAP operating expenses declined 9% to $261 million, mainly due to a 14% reduction in sales and marketing expenses. As a percentage of revenues, non-GAAP operating expenses contracted 30 bps to 24.7%.
The non-GAAP operating income soared 17% to $183 million from $156 million reported in the year-ago quarter. The operating margin improved to 17.3% from 13.6% in the year-ago quarter. The increase in the operating margin mainly reflects improved gross margins and lower operating expenses as a percentage of sales.
Liquidity and Shareholder Return
As of Sep 30, 2023, LOGI’s cash and cash equivalents were $1.16 billion, down from $1.25 billion recorded in the previous quarter. Additionally, the company generated $223 million in cash from operational activities in the second quarter and $463.1 million in the first half of fiscal 2024.
In the second quarter, the company repurchased shares worth $94 million and paid out $182.3 in dividends. In the first half of fiscal 2024, it bought back shares worth $188.9 million.
Fiscal 2024 Guidance Update
Buoyed by the stronger-than-expected second-quarter performance, Logitech raised its forecast for revenues and non-GAAP operating income. The company now expects fiscal 2024 sales in the band of $4.0-$4.15 billion, indicating a decline of 9-12%. Earlier, it had anticipated revenues to decline 12-16% to the $3.8-$4 billion band.
Non-GAAP operating income is anticipated in the range of $525-$575 million, suggesting a 2-11% fall year over year. The company previously forecasted non-GAAP operating income to decline 15-32% to the $400-$500 million range.
Recent News
On Dec 5, Logitech announced that its brand Logitech G has launched the fifth generation of ASTRO A50 Series console gaming headset named ASTRO A50 X LIGHTSPEED Wireless Gaming Headset and Base Station.
On Oct 30, Logitech announced that Hanneke Fabre has been appointed as its new Chief Executive Officer.
On Oct 16, Logitech introduced Zone Wireless 2, a top-of-the-line business headset that uses AI to deliver unique two-way noise-free calling experiences.
On Oct 12, Logitech’s Logitech G brand announced that the award-winning Logitech G Adaptive Gaming Kit will be available for the Access controller for PS5 in January 2024.
On Oct 12, Logitech’s Logitech G brand unveiled the new Streamlabs Desktop Plugin for the Loupedeck. The new plugin provides Streamlabs creators with simple and powerful controls over their live streams, and direct access to the Streamlabs Desktop software using Loupedeck devices.
On Oct 11, Logitech unveiled Wave Keys and Wave Keys for Business, a wireless ergonomic keyboard to address the increased need for wellbeing and comfort at the desk.
On Sep 19, Logitech G, a brand of Logitech, released three new products for the gaming and streaming space, the Logitech G Yeti GX microphone, Logitech G Yeti Orb microphone, and the Logitech G Litra Beam LX light.
On Sep 13, Logitech announced that during its annual general meeting (AGM) the Company’s shareholders approved a dividend of approximately CHF 1.06 per share — an increase of approximately CHF 0.10 compared to the Fiscal Year 2022 dividend.
On Sep 9, Logitech introduced latest generation of Yeti microphones and Litra lights, aiming to with objective of delivering content creators with achieving best visual and audio quality.
On Sep 6, Logitech’s brand, Ultimate Ears, released EPICBOOM portable Bluetooth speaker.
On Sep 5, Logitech introduced Logitech G PRO X TKL LIGHTSPEED Gaming Keyboard and Logitech G PRO X SUPERLIGHT 2 Gaming Mouse. Logitech G is a brand of Logitech.
On Aug 29, Logitech was awarded the 2023 Google Cloud DEI Partner of the Year Award in North America during the Google Cloud Next event in San Francisco.
On Jul 18, Logitech announced that it has acquired Loupedeck, a Helsinki-based creator of custom consoles and software designed to make the creative process faster and more intuitive for streamers, creators and gamers.
Valuation
Logitech’s shares have gained 37.4% in the last six-month period while it climbed 38.9% in the year-to-date period. Stocks in the Zacks sub-industry have increased 7.3% in the last six months, while the Zacks Computer & Technology sector has jumped 9.1%. Year to date, the Zacks sub-industry increased 16.1% and the sector gained 43.7%.
The S&P 500 Index has increased 6.5% in the past six-month period while it gained 19.6% year to date.
The stock is currently trading at 3.20X forward 12-month sales, which compares with 4.53X for the Zacks sub-industry, 3.94X for the Zacks sector and 3.68X for the S&P 500 index.
Over the past five years, the stock has traded as high as 4.52X and as low as 1.38X, with a five-year median of 2.46X. Our Outperform recommendation indicates that the stock will perform better than the market. Our $99 price target reflects 3.68X forward 12-month sales.
The table below shows summary valuation data for LOGI

Industry Analysis(1)Zacks Industry Rank: Bottom 11% (216 out of 243)

Top Peers(1)
| Company (Ticker) | Rec | Rank |
| Identiv, Inc. (INVE) | Neutral | |
| Turtle Beach Corporation (TBCH) | Neutral | |
| Datatrak International Inc. (DTRK) | NA | NA |
| Immersion Corporation (IMMR) | NA | NA |
| Socket Mobile, Inc. (SCKT) | NA | NA |
| TransAct Technologies Incorporated (TACT) | NA | NA |
| Telkonet Inc. (TKOI) | NA | NA |
| Planet Image International Limited (YIBO) | NA | NA |
Industry Comparison(1)Industry: Computer - Peripheral Equipment |
Industry Peers |
| LOGI | |
|---|---|
| Zacks Recommendation (Long Term) | Neutral |
| Zacks Rank (Short Term) | |
| VGM Score | |
| Market Cap | 13.60 B |
| # of Analysts | 6 |
| Dividend Yield | 0.00% |
| Value Score | |
| Cash/Price | 0.13 |
| EV/EBITDA | 14.97 |
| PEG Ratio | 3.77 |
| Price/Book (P/B) | 5.82 |
| Price/Cash Flow (P/CF) | 19.59 |
| P/E (F1) | 28.19 |
| Price/Sales (P/S) | 2.85 |
| Earnings Yield | 6.05% |
| Debt/Equity | 0.00 |
| Cash Flow ($/share) | 4.73 |
| Growth Score | |
| Hist. EPS Growth (3-5 yrs) | -3.04% |
| Proj. EPS Growth (F1/F0) | 2.17% |
| Curr. Cash Flow Growth | 7.64% |
| Hist. Cash Flow Growth (3-5 yrs) | 13.63% |
| Current Ratio | 2.21 |
| Debt/Capital | 0.00% |
| Net Margin | 14.94% |
| Return on Equity | 33.57% |
| Sales/Assets | 1.26 |
| Proj. Sales Growth (F1/F0) | -9.10% |
| Momentum Score | |
| Daily Price Chg | -0.19% |
| 1 Week Price Chg | 0.62% |
| 4 Week Price Chg | 3.74% |
| 12 Week Price Chg | -11.06% |
| 52 Week Price Chg | 3.49% |
| 20 Day Average Volume | 865,882 |
| (F1) EPS Est 1 week change | 0.00% |
| (F1) EPS Est 4 week change | 0.00% |
| (F1) EPS Est 12 week change | 1.67% |
| (Q1) EPS Est Mthly Chg | 0.00% |
| X Industry | S&P 500 |
|---|---|
| - | - |
| - | - |
| - | - |
| 83.85 M | 39.89 B |
| 1 | 22 |
| 0.00% | 1.47% |
| - | - |
| 0.29 | 0.04 |
| 1.77 | 13.73 |
| 1.77 | 1.82 |
| 0.97 | 3.35 |
| 3.61 | 13.98 |
| 16.54 | 18.75 |
| 0.75 | 3.08 |
| 4.05% | 5.33% |
| 0.00 | 0.56 |
| 0.36 | 9.62 |
| - | - |
| -10.09% | 7.55% |
| 12.24% | 9.84% |
| 19.02% | 7.94% |
| 13.31% | 8.91% |
| 2.10 | 1.19 |
| 0.00% | 38.05% |
| -2.41% | 12.75% |
| -3.96% | 17.16% |
| 0.90 | 0.53 |
| 0.00% | 5.53% |
| - | - |
| -0.10% | -0.61% |
| 0.29% | -1.60% |
| -1.19% | -2.98% |
| -5.23% | -2.96% |
| -4.30% | 17.61% |
| 186,522 | 2,972,559 |
| 0.00% | 0.00% |
| 0.00% | 0.00% |
| -1.17% | 0.34% |
| 0.00% | 0.00% |
| APELY | MRCY | SSYS |
|---|---|---|
| Outperform | Neutral | Neutral |
| 2.72 B | 4.69 B | 678.18 M |
| 1 | 4 | 4 |
| 1.80% | 0.00% | 0.00% |
| 0.29 | 0.07 | 0.36 |
| 3.68 | 76.07 | -23.96 |
| 0.62 | 1.46 | NA |
| 0.95 | 3.22 | 0.79 |
| 8.93 | 51.24 | 21.18 |
| 23.97 | 85.19 | 55.23 |
| 0.40 | 4.98 | 1.23 |
| 4.17% | 1.18% | 1.78% |
| 0.12 | 0.41 | 0.02 |
| 2.93 | 1.53 | 0.37 |
| NA | -40.86% | NA |
| 62.69% | 43.75% | -6.67% |
| -14.48% | 475.53% | 31.97% |
| -6.22% | -10.05% | 15.15% |
| 2.11 | 2.96 | 3.57 |
| 11.07% | 28.83% | 2.31% |
| 5.06% | -3.23% | -18.92% |
| 5.32% | 1.28% | -1.37% |
| 1.35 | 0.38 | 0.51 |
| NA | 3.90% | 2.50% |
| -3.26% | -4.03% | -3.91% |
| -2.86% | -9.56% | -10.16% |
| -4.70% | -5.10% | -28.26% |
| 1.53% | 12.22% | -12.07% |
| 23.90% | 68.01% | -20.26% |
| 695 | 490,422 | 1,068,505 |
| 0.00% | 0.00% | 0.95% |
| 0.00% | -14.46% | -103.92% |
| 6.86% | -54.25% | -103.92% |
| NA | -41.67% | -21.43% |
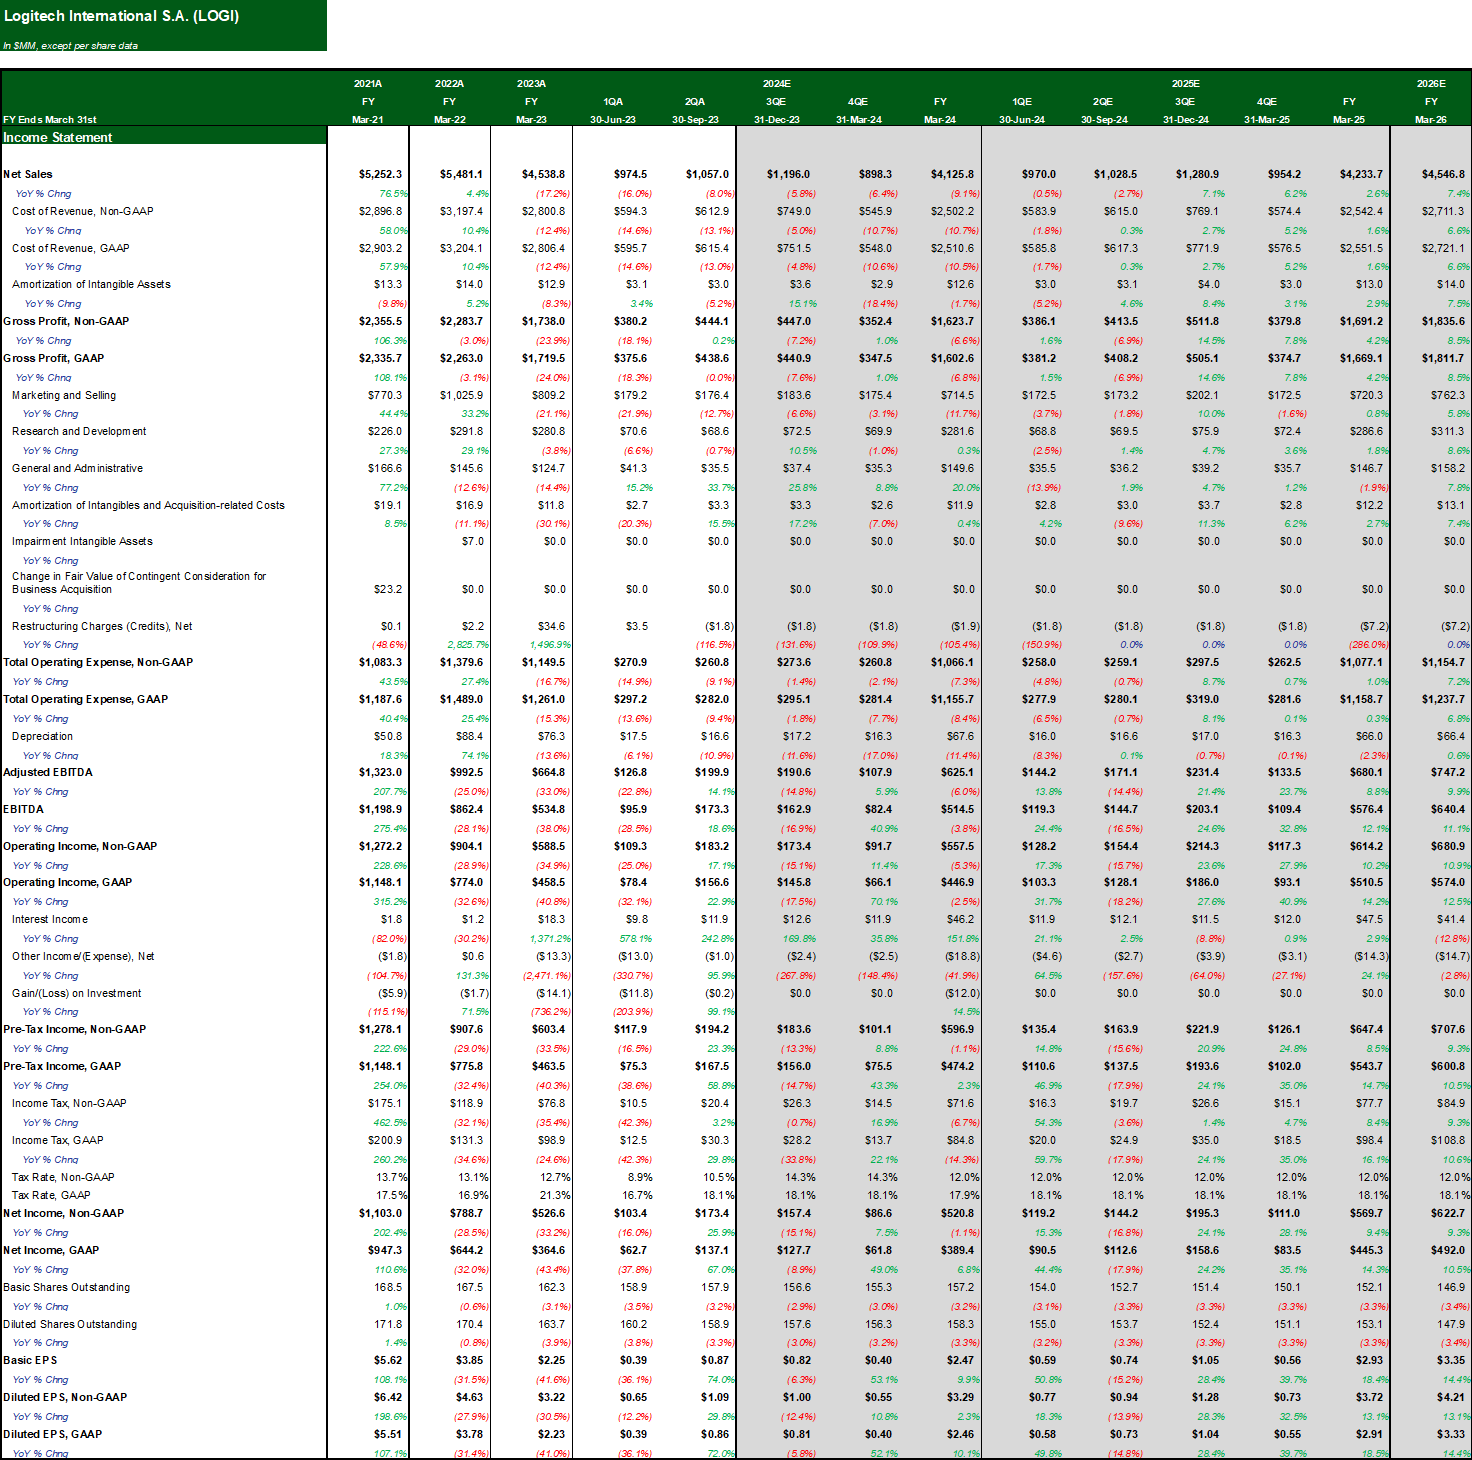
Analyst Earnings Model(2)
Zacks Stock Rating System
We offer two rating systems that take into account investors' holding horizons: Zacks Rank and Zacks Recommendation. Each provides valuable insights into the future profitability of the stock and can be used separately or in combination with each other depending on your investment style.
Zacks Recommendation
The Zacks Recommendation aims to predict performance over the next 6 to 12 months. The foundation for the quantitatively determined Zacks Recommendation is trends in the company's estimate revisions and earnings outlook. The Zacks Recommendation is broken down into 3 Levels; Outperform, Neutral and Underperform. Unlike many Wall Street firms, we have an excellent balance between the number of Outperform and Neutral recommendations. Our team of 70 analysts are fully versed in the benefits of earnings estimate revisions and how that is harnessed through the Zacks quantitative rating system. But we have given our analysts the ability to override the Zacks Recommendation for the 1200 stocks that they follow. The reason for the analyst over-rides is that there are often factors such as valuation, industry conditions and management effectiveness that a trained investment professional can spot better than a quantitative model.
Zacks Rank
The Zacks Rank is our short-term rating system that is most effective over the one- to three-month holding horizon. The underlying driver for the quantitatively-determined Zacks Rank is the same as the Zacks Recommendation, and reflects trends in earnings estimate revisions.
Zacks Style Scores
| Value Score |
|
| Growth Score |
|
| Momentum Score |
|
| VGM Score |
|
The Zacks Style Score is as a complementary indicator to the Zacks rating system, giving investors a way to focus on the highest rated stocks that best fit their own stock picking preferences.
Academic research has proven that stocks with the best Value, Growth and Momentum characteristics outperform the market. The Zacks Style Scores rate stocks on each of these individual styles and assigns a rating of A, B, C, D and F. We also produce the VGM Score (V for Value, G for Growth and M for Momentum), which combines the weighted average of the individual Style Scores into one score. This is perfectly suited for those who want their stocks to have the best scores across the board.
As an investor, you want to buy stocks with the highest probability of success. That means buying stocks with a Zacks Recommendation of Outperform, which also has a Style Score of an A or a B.
Disclosures
This report contains independent commentary to be used for informational purposes only. The analysts contributing to this report do not hold any shares of this stock. The analysts contributing to this report do not serve on the board of the company that issued this stock. The EPS and revenue forecasts are the Zacks Consensus estimates, unless otherwise indicated in the report’s first-page footnote. Additionally, the analysts contributing to this report certify that the views expressed herein accurately reflect the analysts' personal views as to the subject securities and issuers. ZIR certifies that no part of the analysts' compensation was, is, or will be, directly or indirectly, related to the specific recommendation or views expressed by the analyst in the report.
Additional information on the securities mentioned in this report is available upon request. This report is based on data obtained from sources we believe to be reliable, but is not guaranteed as to accuracy and does not purport to be complete. Any opinions expressed herein are subject to change.
ZIR is not an investment advisor and the report should not be construed as advice designed to meet the particular investment needs of any investor. Prior to making any investment decision, you are advised to consult with your broker, investment advisor, or other appropriate tax or financial professional to determine the suitability of any investment. This report and others like it are published regularly and not in response to episodic market activity or events affecting the securities industry.
This report is not to be construed as an offer or the solicitation of an offer to buy or sell the securities herein mentioned. ZIR or its officers, employees or customers may have a position long or short in the securities mentioned and buy or sell the securities from time to time. ZIR is not a broker-dealer. ZIR may enter into arms-length agreements with broker-dealers to provide this research to their clients. Zacks and its staff are not involved in investment banking activities for the stock issuer covered in this report.
ZIR uses the following rating system for the securities it covers. Outperform- ZIR expects that the subject company will outperform the broader U.S. equities markets over the next six to twelve months. Neutral- ZIR expects that the company will perform in line with the broader U.S. equities markets over the next six to twelve months. Underperform- ZIR expects the company will underperform the broader U.S. equities markets over the next six to twelve months.
No part of this report can be reprinted, republished or transmitted electronically without the prior written authorization of ZIR.