

Summary
Apple’s third-quarter fiscal 2026 results showed broad demand across iPhone and Mac, while Services benefited from a record installed base and rising paid subscriptions. Siri AI and deeper on-device intelligence can strengthen ecosystem engagement and support future hardware upgrades. Apple’s cash generation and continued buybacks also provide support for investors. However, fourth-quarter fiscal 2026 growth is expected to slow as foreign exchange and supply constraints intensify. Memory costs are rising, recent price increases may test demand, and tariff refunds provided a temporary benefit to margins and earnings. App Store changes and regulatory actions remain an added risk to Services economics. These offsets leave the long-term growth case intact, but the near-term mix of execution, cost and policy risks supports a Neutral view.
Data Overview
| 52 Week High-Low | $344.57 - $225.95 |
|---|---|
| 20 Day Average Volume (sh) | 40,626,184 |
| Market Cap | $4,745.0 B |
| YTD Price Change | 19.6% |
| Beta | 1.08 |
| Dividend / Div Yld | $1.08 / 0.3% |
| Industry | Computer - Micro Computers |
| Zacks Industry Rank | Top 19% (46 out of 243) |
| Last EPS Surprise | 1.6% |
|---|---|
| Last Sales Surprise | 0.6% |
| EPS F1 Est- 4 week change | 0.0% |
| Expected Report Date | 10/29/2026 |
| Earnings ESP | 5.5% |
| P/E TTM | 37.8 |
|---|---|
| P/E F1 | 36.7 |
| PEG F1 | 2.8 |
| P/S TTM | 10.2 |
Price, Consensus & Surprise(1)

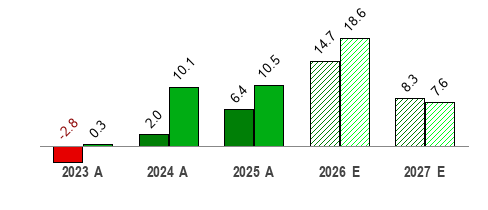
Sales and EPS Growth Rates (Y/Y %)(1)
Sales  |
EPS  |
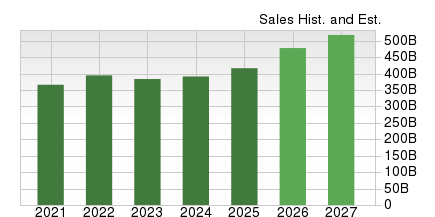
Sales Estimates (millions of $)(1)
| Q1 | Q2 | Q3 | Q4 | Annual* | |
|---|---|---|---|---|---|
2027 |
154,257 E |
120,899 E |
118,343 E |
121,879 E |
518,008 E |
2026 |
143,756 A |
111,184 A |
109,417 A |
112,836 E |
477,420 E |
2025 |
124,300 A |
95,359 A |
94,036 A |
102,466 A |
416,161 A |
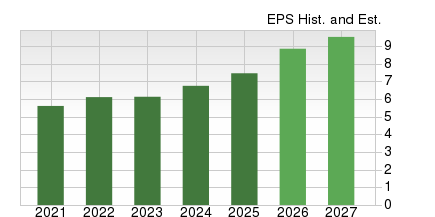
EPS Estimates(1)
| Q1 | Q2 | Q3 | Q4 | Annual* | |
|---|---|---|---|---|---|
2027 |
2.91 E |
2.16 E |
2.09 E |
2.24 E |
9.54 E |
2026 |
2.84 A |
2.01 A |
1.91 A |
1.98 E |
8.85 E |
2025 |
2.40 A |
1.65 A |
1.57 A |
1.85 A |
7.46 A |
*Quarterly figures may not add up to annual.
(1) The data in the charts and tables, including the Zacks Consensus EPS and sales estimates, is as of 09/01/2026.
(2) The report's text and the price target are as of 08/06/2026.
Overview
As of 09/01/2026
Apple’s business primarily runs around its flagship iPhone. The Services portfolio that includes revenues from cloud services, App store, Apple Music, AppleCare, Apple Pay, and licensing and other services now contributes a significant part of revenues.
The non-iPhone devices like Apple Watch and AirPods continue to gain traction. In fact, Apple dominates the Wearables and Hearables markets due to the growing adoption of Watch and AirPods. Solid uptake of Apple Watch has helped Apple strengthen its presence in the personal health monitoring space.
Apple has expanded its non-iPhone portfolio with the launch of Apple Vision Pro, a spatial computer that blends digital content with the physical world.
Headquartered in Cupertino, CA, Apple also designs, manufactures and sells iPad, MacBook and HomePod. These devices are powered by software applications including iOS, macOS, watchOS and tvOS operating systems.
Apple’s other services include subscription-based Apple News+, Apple Card, Apple Arcade, new Apple TV app, Apple TV channels and Apple TV+, a new subscription service.
In fiscal 2025, Apple generated $416.16 billion in total revenues. The company’s flagship device iPhone accounted for 50.4% of total revenues. Services, Mac and iPad category contributed 26.2%, 8.1% and 6.7%, respectively. Wearables, Home and Accessories products category contributed 8.6%.
Apple primarily reports revenues on a geographic basis, namely the Americas (North & South America), Europe (European countries, India, Middle East and Africa), Greater China (China, Hong Kong & Taiwan), Japan and Rest of Asia Pacific (Australia & other Asian Countries).
In fiscal 2025, Americas, Europe, Greater China, Japan and Rest of Asia-Pacific accounted for 42.9%, 26.7%, 15.5%, 6.9% and 8.1% of total revenues, respectively.
Apple faces stiff competition from the likes of Samsung, Xiaomi, Oppo, Vivo, Google, Huawei and Motorola in the smartphone market. Lenovo, HP, Dell, Acer and Asus are its primary competitors in the PC market. Other notable competitors are Google & Amazon (smart speakers) and Fitbit & Xiaomi (wearables).

As of 09/01/2026
Reasons To Buy:
Apple is embedding Apple Intelligence and Siri AI across its platforms, with on-device processing and private cloud compute supporting a more personal and private experience. In the third quarter of fiscal 2026, iPhone revenues increased 22% year over year to $54.3 billion, while the active installed base and upgrader count reached new highs. Apple’s installed base exceeded 2.5 billion active devices, reaching an all-time high across all major product categories and geographic segments. Apple said public-beta feedback for Siri AI has been very positive, supporting its view that deeper intelligence can strengthen product utility and future upgrade demand.
Apple believes its biggest AI advantage is not simply model performance, but the ability to deliver highly personalized AI while protecting user privacy. Apple continues to push AI workloads onto its own silicon, reducing reliance on cloud computing while improving response times and protecting user data. For larger AI tasks that require cloud resources, Apple processes data using its own privacy-focused infrastructure rather than conventional cloud architectures. As AI becomes more deeply integrated into consumer devices, Apple’s longstanding privacy reputation may become an increasingly important competitive advantage.
Services revenues reached a June-quarter record of $30.7 billion in the third quarter of fiscal 2026, up 12% year over year. Apple set records across every Services category and surpassed 1.5 billion paid subscriptions, while transacting and paid accounts also reached new highs. The growing popularity of Apple’s streaming service, as well as Arcade, is noteworthy. Privacy-focused AI is also expected to become a new Services growth driver as heavy AI users may eventually upgrade to higher-tier iCloud+ subscriptions to support expanded compute needs. Apple expects September-quarter Services growth to remain broadly similar to the June-quarter rate after adjusting for an additional foreign-exchange drag, indicating that recurring engagement remains intact despite external pressure.
Apple Pay and related transaction services remain important parts of the Services platform. Payment services reached an all-time revenue record in the third quarter of fiscal 2026, while Apple Pay recorded its highest user levels across developed and emerging markets. Apple is also expanding features, such as bill splitting through Apple Cash and merchant access. Rising use of payments can increase transaction frequency and reinforce customer ties across Apple’s installed base.
Mac revenues increased 29% year over year to $10.4 billion in the third quarter of fiscal 2026 despite supply constraints. Apple reported records for both upgraders and customers new to Mac, with MacBook Neo helping expand adoption in education and enterprise. Management cited deployments that displaced Windows and Chromebook devices, while on-device AI use cases are broadening across regulated and creative workflows. These developments support a wider role for Mac within Apple’s ecosystem over time.
Apple ended the third quarter of fiscal 2026 with about $147 billion in cash and marketable securities and $84 billion in total debt. Operating cash flow reached a June-quarter record of $34.4 billion. The company returned $33 billion to shareholders during the quarter, including $4 billion in dividends and $25.8 billion in repurchases. Strong liquidity allows Apple to fund rising product and AI investment while continuing a sizable capital-return program.
Reasons To Sell:
Apple expects supply constraints to increase materially in the fourth quarter of fiscal 2026 and affect iPhone, Mac and iPad. Advanced-node availability remains the main limitation, while memory prices are expected to rise further beyond September. Management guided to 47% to 48% gross margin, including about a one percentage-point benefit from tariff refunds. With the refund benefit easing and carry-in inventory support declining over time, higher component costs could weigh on product profitability and availability.
Apple’s results remain tied to iPhone, which generated $54.3 billion of revenues in the June quarter and is central to the iOS ecosystem. Management recently raised prices on some products to offset memory inflation, which can slow down demand. The smartphone market remains crowded with aggressive competition from Android vendors, which can affect upgrade timing, pricing and share. Even with Apple Intelligence features supporting differentiation, a weaker iPhone cycle would flow through to hardware units and downstream Services engagement.
Apple continues to face competition across tablets, personal computers and wearables from established vendors and lower-priced alternatives. In the third quarter of fiscal 2026, iPad revenue fell 6% year over year to $6.2 billion. Apple attributed the iPad decline to a difficult launch comparison. Apple faces significant competition from the likes of Dell and Lenovo in the PC market, while Samsung, Lenovo, OnePlus, Microsoft (surface pro) and ASUS are noteworthy competitors in the tablet market. Continued competition may affect market share, pricing flexibility and upgrade timing, while supply constraints could limit Apple’s ability to meet demand for Mac and iPad products in the near term.
Apple continues to face antitrust and platform regulation scrutiny. In the European Union (EU), the European Commission fined the company €500 million under the Digital Markets Act and ordered it to remove restrictions that limit developers from directing users to purchasing channels outside the App Store. Apple has also changed iOS, iPadOS, Safari and App Store terms in the EU, including alternative distribution and payment options. Management said App Store performance in the third quarter of fiscal 2026 was affected by business-model changes in some countries and a U.S. court ruling on link-out transactions, alongside softness in mobile gaming. Siri AI will also face delayed availability on iPhone and iPad in the EU while Apple works with regulators. In the United States, the Department of Justice and several state and district attorneys general allege that Apple monopolized or attempted to monopolize smartphone markets. Related private lawsuits seek monetary and nonmonetary relief. Apple also remains involved in the Epic Games dispute over App Store payment rules. These constraints may limit monetization, raise compliance costs and create uneven feature rollouts across regions.
Last Earnings Report
Apple Q3 Earnings Beat Estimates, iPhone Drives Top-Line Growth
Apple delivered third-quarter fiscal 2026 earnings of $2.02 per share, up 28.7% year over year. After adjusting for non-recurring items, earnings were $1.91 per share, which beat the Zacks Consensus Estimate by 1.6%.
Net sales increased 16.4% year over year to $109.42 billion, surpassing the consensus mark by 0.6%. The results reflected record June-quarter revenues from iPhone, Mac and Services. Apple’s installed base exceeded 2.5 billion active devices, reaching an all-time high across all major product categories and geographic segments.
AAPL’s iPhone and Mac Set June Records
Product sales increased 18.1% year over year to $78.68 billion and accounted for 71.9% of total revenues. iPhone remained the primary growth engine, with sales rising 21.7% year over year to $54.25 billion. The category set June-quarter records across every geographic segment and benefited from strong demand for the iPhone 17 family.
Mac sales surged 28.7% year over year to $10.35 billion, driven by MacBook Neo and MacBook Pro. Apple achieved records for both upgraders and customers new to Mac, despite supply constraints tied mainly to advanced-node chips used in its systems.
Apple Services Extend Recurring Revenue Growth
Services revenues advanced 12.1% year over year to a June-quarter record of $30.74 billion. The segment represented 28.1% of total sales and produced records across every services category.
Cloud and payment services reached all-time highs, while advertising, the App Store, AppleCare, Music and video posted June-quarter records. Paid subscriptions surpassed 1.5 billion, supported by record transacting and paid accounts. However, Apple noted softness in mobile gaming and changes to the App Store business model in certain markets.
AAPL’s Other Product Categories Deliver Mixed Results
iPad sales declined 5.9% year over year to $6.19 billion, reflecting a difficult comparison with the prior-year launch of the A16-powered iPad. Still, the iPad installed base reached a record, and more than half of quarterly buyers were new to the product.
Wearables, Home and Accessories sales increased 6.5% year over year to $7.88 billion. Growth was broad-based across developed and emerging markets. Apple Watch set a June-quarter record for upgraders, while more than half of customers purchasing the device were first-time buyers.
Apple Posts Broad-Based Geographic Growth
Americas sales rose 11.1% year over year to $45.78 billion and remained Apple’s largest geographic market. Europe revenues jumped 22.4% year over year to $29.40 billion.
Greater China sales also climbed 22.4% to $18.82 billion, supported by strength across Apple’s product portfolio. Japan sales increased 13.4% to $6.55 billion, while Rest of Asia Pacific sales grew 15.6% to $8.87 billion. The company achieved June-quarter revenue records across every geographic segment.
AAPL’s Margins Gain From Tariff Refunds
Gross margin expanded 360 basis points (bps) on a year-over-year basis to 50.1%. The result included a favorable impact of roughly 2 percentage points from tariff refunds. Products gross margin was 40.1%, up 140 bps sequentially. Services gross margin reached 75.6%, down 110 bps sequentially, primarily attributed to unfavorable mix.
Operating expenses increased 22.9% year over year to $19.08 billion as Apple stepped up research and development (R&D) investments. R&D expenses surged 32.3% year over year to $11.73 billion, while selling, general and administrative expenses rose 10.5% to $7.35 billion.
Operating income increased 26.6% year over year to $35.70 billion.
Apple's Strong Cash Flow Supports Shareholder Returns
Apple ended the period with $147 billion in cash and marketable securities and $84 billion in total debt.
Operating cash flow totaled $34.4 billion during the quarter, setting a June-quarter record.
The company returned $33 billion to shareholders, including $25.8 billion through share repurchases and $4 billion in dividends and equivalents. The board declared a quarterly dividend of 27 cents per share.
AAPL's Outlook Flags Supply and Memory Pressure
For the fourth quarter of fiscal 2026, Apple expects revenues to increase 9-11% year over year. Management anticipates foreign exchange to reduce the growth rate by about 2.5 percentage points sequentially, while supply constraints are expected to intensify across iPhone, Mac and iPad.
Apple expects iPhone to grow at mid-teens year over year in the September quarter. Services year-over-year reported growth rate is expected to be largely similar to June growth rate after removing the 2.5 percentage point negative impact from foreign exchange.
Gross margin is projected between 47% and 48%, including a roughly 1-percentage-point benefit from tariff refunds. Operating expenses are expected between $19.1 billion and $19.4 billion.
Apple also expects higher memory costs to pressure profitability, partially offset by carry-in inventory, lower costs for certain non-memory components and favorable product mix.
Recent News
On July 28, Apple announced Apple Upgrade, a new product leasing program provided by Klarna for iPhone, Apple Watch, Mac, and iPad available on the Apple Store online, in the Apple Store app, and at Apple Store locations in the United States. Apple Upgrade offers 12 and 24-month leasing options for iPhone and Apple Watch, and 24 and 36-month leasing options for Mac and iPad.
On July 23, Apple and Ford announced that Apple Maps will be integrated directly into Ford’s upcoming Universal Electric Vehicle (UEV) Platform through Apple’s new MapKit for Automotive SDK.
On July 8, Apple signed a new multiyear agreement worth more than $30 billion with Broadcom to develop custom silicon and advanced wireless technologies, expanding U.S. chip manufacturing and strengthening its domestic supply chain.
Apple also scored a historic 89 nominations across 15 programs for the 78th Primetime Emmy Awards. Apple’s streaming service leads as the network with the most nominations in the Outstanding Drama and Outstanding Comedy series categories.
On June 30, Apple upgraded Creator Studio with new AI-powered capabilities and tighter integration across its creative apps. The update links Pixelmator Pro with Final Cut Pro, Pages, Keynote and Numbers, allowing users to edit images seamlessly across applications. Final Cut Pro adds smarter editing tools, while Logic Pro introduces a new Producer Project and enhanced music creation features. Users can also generate custom shapes to personalize projects. Apple said the enhancements make Creator Studio faster, more intelligent and better connected, further strengthening its creative software ecosystem for professionals and content creators.
On June 18, Apple announced iOS changes in Brazil following an agreement with competition regulator CADE. Starting with iOS 26.5, developers can distribute apps through authorized alternative app marketplaces and offer external payment options for digital goods and services. Apple is also introducing safeguards, including app notarization and marketplace authorization, to help address privacy and security risks.
On June 9, Apple introduced new intelligence-powered features across its services, including enhanced Flyover views and Local Lists in Apple Maps, expanded sharing options in Find My, bill-splitting with Apple Cash using Visual Intelligence, video podcast support on Mac and tvOS, redesigned Shared Albums in iCloud, and a new Apple Fitness+ program. These updates will arrive with Apple’s 2027 software releases this fall.
On June 8, Apple introduced new intelligence frameworks, AI integration APIs, and enhanced developer tools to accelerate app creation. Xcode 27 expands agentic coding capabilities, while platform updates make apps faster, more adaptive, and easier to build. The new tools help developers integrate advanced AI features and streamline workflows across Apple’s ecosystem.
Apple unveiled the next generation of Apple Intelligence, introducing more capable on-device and cloud AI features, deeper integration across apps, and major Siri upgrades. The update brings enhanced language understanding, personalized assistance, live translation, visual intelligence improvements, and new developer tools, all designed with Apple’s privacy-focused approach at the core.
Apple introduced Siri AI, a significantly more capable and personal assistant powered by Apple Intelligence. The upgraded Siri delivers richer conversational abilities, deeper personal context awareness, and the ability to take actions across apps. Built with privacy at its core, Siri AI combines on-device processing and Private Cloud Compute to provide more helpful, secure, and personalized assistance.
However, Apple said Siri AI will not be available in the European Union with iOS 27 and iPadOS 27 at launch due to regulatory uncertainties stemming from the Digital Markets Act (DMA). The company stated that some planned features could pose privacy, security, and user safety risks under current requirements and will be delayed while it works with regulators.
Apple also previewed new child safety features designed to help protect children and give parents greater control over their families’ digital experiences. The updates include enhanced parental controls, safer communication tools, age-appropriate protections, and expanded privacy safeguards, all aimed at creating a safer environment for children across Apple devices and services.
On April 20, Apple announced that Tim Cook will transition to executive chairman while long-time hardware leader John Ternus will take over as CEO from September 2026.
On May 19, Apple has expanded its Apple Sports app to more than 90 new countries and regions, making it available in over 170 markets worldwide. The update arrives ahead of the FIFA World Cup 2026 and introduces enhanced tournament tracking, live player formations, and real-time sports updates across football, basketball, tennis, Formula 1, and more.
Apple also unveiled new accessibility features powered by Apple Intelligence across iPhone, iPad, Mac, Apple TV, and Vision Pro.
On April 20, Apple announced on that Tim Cook will transition to Executive Chairman while long-time hardware leader John Ternus will take over as CEO from September 2026.
On March 26, Apple announced that it has expanded its American Manufacturing Program (AMP) by adding new partners including Bosch, Cirrus Logic, TDK, and Qnity Electronics. The move is part of the company’s broader push to strengthen domestic production, create jobs, and enhance its U.S. supply chain. Apple said the partnerships will focus on producing critical components and advanced materials within the United States, reinforcing its long-term investment in American manufacturing.
On March 24, Apple introduced “Apple Business,” a new all-in-one platform designed to help organizations manage devices, employees, and customer engagement. The service integrates multiple existing tools into a single system, offering features such as mobile device management, productivity tools, and support services. The platform aims to simplify operations for businesses of all sizes while enabling them to grow efficiently within Apple’s ecosystem.
Valuation
Apple shares are up 14.4% in the year-to-date period and 45.8% over the trailing 12-month period. Stocks in the Zacks sub-industry and the Zacks Computer & Technology sector are up 19.2% and 18.6%, respectively. Over the past year, the Zacks sub-industry and the sector have been up 139.8% and 32.8%, respectively.
The S&P 500 index has appreciated 13.2% in the year-to-date period and 21.7% in the past year.
The stock is currently trading at 32.8X forward 12-month earnings, which compares to 31.49X for the Zacks sub-industry, 21.96X for the Zacks sector, and 20.93X for the S&P 500 index.
Over the past five years, the stock has traded as high as 36.06X and as low as 19.78X, with a five-year median of 27.77X. Our Neutral recommendation indicates that the stock will perform in line with the market. Our $327 price target reflects 34.44X forward 12-month earnings.
The table below shows summary valuation data for AAPL

Industry Analysis(1)
Zacks Industry Rank: Top 19% (46 out of 243)

Top Peers (1)
| Company (Ticker) | Rec | Rank |
|---|---|---|
| Amazon.com, Inc. (AMZN) | Outperform |
2
|
| Dell Technologies In… (DELL) | Outperform |
1
|
| The Walt Disney Comp… (DIS) | Neutral |
3
|
| Alphabet Inc. (GOOGL) | Neutral |
3
|
| HP Inc. (HPQ) | Neutral |
2
|
| Microsoft Corporatio… (MSFT) | Neutral |
3
|
| Netflix, Inc. (NFLX) | Neutral |
3
|
| Oracle Corporation (ORCL) | Neutral |
2
|
Industry Comparison(1)Industry: Computer - Micro Computers |
Industry Peers |
|||||
|---|---|---|---|---|---|---|
| AAPL | X Industry | S&P 500 | DELL | GOOGL | HPQ | |
| Zacks Recommendation (Long Term) | Neutral | - | - | Outperform | Neutral | Neutral |
| Zacks Rank (Short Term) | 3 |
- | - | 1 | 3 | 2 |
| VGM Score | D |
- | - | B | C | A |
| Market Cap | 4,745.01 B | 47.87 B | 45.94 B | 275.45 B | 4,097.29 B | 28.24 B |
| # of Analysts | 10 | 5 | 22.5 | 9 | 18 | 6 |
| Dividend Yield | 0.33% | 0.46% | 1.39% | 0.59% | 0.26% | 3.83% |
| Value Score | F |
- | - | D | D | A |
| Cash/Price | 0.01 | 0.11 | 0.04 | 0.04 | 0.06 | 0.15 |
| EV/EBITDA | 32.92 | 11.39 | 14.63 | 25.72 | 22.07 | 7.81 |
| PEG Ratio | 2.83 | 1.64 | 1.87 | 0.83 | 0.97 | 1.64 |
| Price/Book (P/B) | 44.13 | 6.44 | 3.65 | NA | 6.58 | NA |
| Price/Cash Flow (P/CF) | 38.83 | 21.72 | 15.01 | 29.63 | 26.44 | 7.53 |
| P/E (F1) | 36.74 | 22.02 | 18.55 | 22.02 | 16.34 | 9.79 |
| Price/Sales (P/S) | 10.16 | 1.82 | 3.07 | 1.82 | 9.19 | 0.48 |
| Earnings Yield | 2.72% | 4.54% | 5.38% | 4.54% | 6.12% | 10.22% |
| Debt/Equity | 0.66 | 0.00 | 0.55 | -16.82 | 0.16 | -85.52 |
| Cash Flow ($/share) | 8.37 | 5.59 | 9.70 | 14.34 | 12.67 | 4.16 |
| Growth Score | B |
- | - | B | B | B |
| Hist. EPS Growth (3-5 yrs) | 7.97% | 1.74% | 7.01% | 2.09% | 26.69% | -4.84% |
| Proj. EPS Growth (F1/F0) | 18.63% | 59.69% | 12.56% | 87.38% | 89.64% | 2.56% |
| Curr. Cash Flow Growth | 7.17% | 7.17% | 8.27% | 9.72% | 32.81% | -6.74% |
| Hist. Cash Flow Growth (3-5 yrs) | 12.56% | 4.23% | 9.21% | -4.09% | 23.22% | -0.68% |
| Current Ratio | 1.00 | 0.95 | 1.18 | 0.95 | 2.72 | 0.79 |
| Debt/Capital | 39.89% | 31.39% | 37.14% | NA | 13.29% | NA |
| Net Margin | 27.62% | 4.14% | 12.94% | 7.53% | 54.77% | 4.14% |
| Return on Equity | 135.46% | 2.22% | 17.69% | -529.54% | 51.32% | -947.78% |
| Sales/Assets | 1.25 | 1.38 | 0.54 | 1.49 | 0.65 | 1.38 |
| Proj. Sales Growth (F1/F0) | 14.70% | 14.72% | 7.36% | 55.20% | 26.00% | 7.90% |
| Momentum Score | D |
- | - | A | C | A |
| Daily Price Chg | 2.61% | 0.82% | -0.71% | -6.80% | -1.28% | 4.33% |
| 1 Week Price Chg | 3.35% | 2.73% | -0.60% | 3.20% | 0.51% | 2.73% |
| 4 Week Price Chg | 5.09% | 5.09% | -1.36% | -9.05% | -11.29% | 8.67% |
| 12 Week Price Chg | 11.90% | 11.90% | 3.31% | 11.32% | -8.03% | 25.58% |
| 52 Week Price Chg | 41.53% | 72.79% | 18.95% | 251.36% | 58.51% | 8.22% |
| 20 Day Average Volume | 40,626,184 | 5,826,488 | 2,595,121 | 5,826,488 | 23,522,956 | 15,261,334 |
| (F1) EPS Est 1 week change | -0.18% | 0.00% | 0.00% | 0.00% | 0.02% | 6.24% |
| (F1) EPS Est 4 week change | 0.05% | 3.10% | 0.09% | 3.10% | -0.07% | 8.38% |
| (F1) EPS Est 12 week change | 0.01% | 4.06% | 1.18% | 4.06% | 43.42% | 8.38% |
| (Q1) EPS Est Mthly Chg | 1.16% | 5.95% | 0.00% | 5.95% | -0.19% | 11.11% |
Zacks Stock Rating System
We offer two rating systems that take into account investors' holding horizons: Zacks Rank and Zacks Recommendation. Each provides valuable insights into the future profitability of the stock and can be used separately or in combination with each other depending on your investment style.
Zacks Recommendation
The Zacks Recommendation aims to predict performance over the next 6 to 12 months. The foundation for the quantitatively determined Zacks Recommendation is trends in the company's estimate revisions and earnings outlook. The Zacks Recommendation is broken down into 3 Levels; Outperform, Neutral and Underperform. Unlike many Wall Street firms, we have an excellent balance between the number of Outperform and Neutral recommendations. Our team of 70 analysts are fully versed in the benefits of earnings estimate revisions and how that is harnessed through the Zacks quantitative rating system. But we have given our analysts the ability to override the Zacks Recommendation for the 1200 stocks that they follow. The reason for the analyst over-rides is that there are often factors such as valuation, industry conditions and management effectiveness that a trained investment professional can spot better than a quantitative model.
Zacks Rank
The Zacks Rank is our short-term rating system that is most effective over the one- to three-month holding horizon. The underlying driver for the quantitatively-determined Zacks Rank is the same as the Zacks Recommendation, and reflects trends in earnings estimate revisions.
Zacks Style Scores
The Zacks Style Score is as a complementary indicator to the Zacks rating system, giving investors a way to focus on the highest rated stocks that best fit their own stock picking preferences.
Academic research has proven that stocks with the best Value, Growth and Momentum characteristics outperform the market. The Zacks Style Scores rate stocks on each of these individual styles and assigns a rating of A, B, C, D and F. We also produce the VGM Score (V for Value, G for Growth and M for Momentum), which combines the weighted average of the individual Style Scores into one score. This is perfectly suited for those who want their stocks to have the best scores across the board.
As an investor, you want to buy stocks with the highest probability of success. That means buying stocks with a Zacks Recommendation of Outperform, which also has a Style Score of an A or a B.
Disclosures
This report contains independent commentary to be used for informational purposes only. The analysts contributing to this report do not hold any shares of this stock. The analysts contributing to this report do not serve on the board of the company that issued this stock. The EPS and revenue forecasts are the Zacks Consensus estimates, unless otherwise indicated in the report's first-page footnote. Additionally, the analysts contributing to this report certify that the views expressed herein accurately reflect the analysts' personal views as to the subject securities and issuers. ZIR certifies that no part of the analysts' compensation was, is, or will be, directly or indirectly, related to the specific recommendation or views expressed by the analyst in the report.
Additional information on the securities mentioned in this report is available upon request. This report is based on data obtained from sources we believe to be reliable, but is not guaranteed as to accuracy and does not purport to be complete. Any opinions expressed herein are subject to change.
ZIR is not an investment advisor and the report should not be construed as advice designed to meet the particular investment needs of any investor. Prior to making any investment decision, you are advised to consult with your broker, investment advisor, or other appropriate tax or financial professional to determine the suitability of any investment. This report and others like it are published regularly and not in response to episodic market activity or events affecting the securities industry.
This report is not to be construed as an offer or the solicitation of an offer to buy or sell the securities herein mentioned. ZIR or its officers, employees or customers may have a position long or short in the securities mentioned and buy or sell the securities from time to time. ZIR is not a broker-dealer. ZIR may enter into arms-length agreements with broker-dealers to provide this research to their clients. Zacks and its staff are not involved in investment banking activities for the stock issuer covered in this report.
ZIR uses the following rating system for the securities it covers. Outperform- ZIR expects that the subject company will outperform the broader U.S. equities markets over the next six to twelve months. Neutral- ZIR expects that the company will perform in line with the broader U.S. equities markets over the next six to twelve months. Underperform- ZIR expects the company will underperform the broader U.S. equities markets over the next six to twelve months.
No part of this report can be reprinted, republished or transmitted electronically without the prior written authorization of ZIR.