

Summary
Salesforce is extending its CRM franchise through Agentforce, Data 360 and an interface strategy that brings its data and workflows into more AI surfaces. Recurring revenues and backlog remain healthy, while rising agent usage, premium bundle bookings and Slack activity support management’s expectation for organic revenue reacceleration. The company also continues to generate cash and return capital. These positives are partly offset by the sensitivity of enterprise spending to macroeconomic conditions, intense competition across CRM, data and AI workflows, and rising leverage and interest costs tied to debt-funded repurchases. Pending acquisitions not only enhance product portfolio but also increase integration demands. With meaningful growth drivers and execution risks, we view the risk-reward profile as balanced.
Data Overview
| 52 Week High-Low | $269.11 - $147.58 |
|---|---|
| 20 Day Average Volume (sh) | 15,852,149 |
| Market Cap | $210.4 B |
| YTD Price Change | -3.5% |
| Beta | 1.20 |
| Dividend / Div Yld | $1.76 / 0.7% |
| Industry | Internet - Software |
| Zacks Industry Rank | Top 36% (90 out of 247) |
| Last EPS Surprise | 80.4% |
|---|---|
| Last Sales Surprise | 0.3% |
| EPS F1 Est- 4 week change | 24.9% |
| Expected Report Date | 12/02/2026 |
| Earnings ESP | 0.7% |
| P/E TTM | 15.2 |
|---|---|
| P/E F1 | 18.1 |
| PEG F1 | 1.6 |
| P/S TTM | 4.8 |
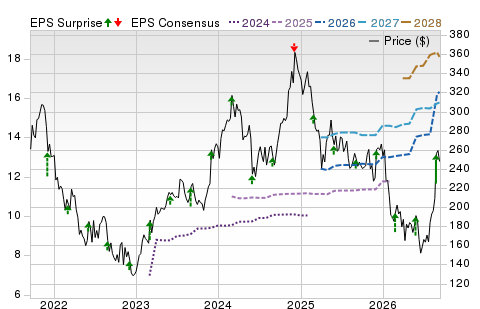
Price, Consensus & Surprise(1)
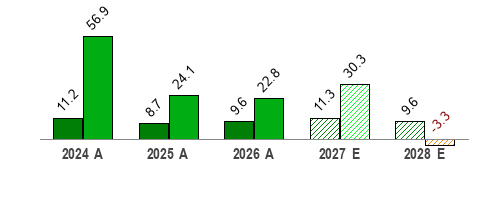
Sales and EPS Growth Rates (Y/Y %)(1)
Sales  |
EPS  |
Sales Estimates (millions of $)(1)
| Q1 | Q2 | Q3 | Q4 | Annual* | |
|---|---|---|---|---|---|
2028 |
12,177 E |
12,414 E |
12,535 E |
13,439 E |
50,695 E |
2027 |
11,133 A |
11,345 A |
11,461 E |
12,303 E |
46,239 E |
2026 |
9,829 A |
10,236 A |
10,259 A |
11,201 A |
41,525 A |
EPS Estimates(1)
| Q1 | Q2 | Q3 | Q4 | Annual* | |
|---|---|---|---|---|---|
2028 |
3.70 E |
3.83 E |
3.85 E |
4.27 E |
15.77 E |
2027 |
3.88 A |
5.90 A |
3.40 E |
3.52 E |
16.31 E |
2026 |
2.58 A |
2.91 A |
3.25 A |
3.81 A |
12.52 A |
*Quarterly figures may not add up to annual.
(1) The data in the charts and tables, including the Zacks Consensus EPS and sales estimates, is as of 09/15/2026.
(2) The report's text and the price target are as of 08/28/2026.
Overview


As of 09/15/2026
Salesforce is the leading provider of on-demand Customer Relationship Management (CRM) software, which enables organizations to better manage critical operations, such as sales force automation, customer service and support, marketing automation, document management, analytics and custom application development. Its offerings are delivered on the Agentforce 360 Platform, which connects customer data with integrated AI across systems, apps and devices.
Headquartered in San Francisco, Salesforce was founded in 1999. Over the course of two and a half decades, the company has established itself as the world’s leading CRM vendor, with a market share of nearly 20%, according to Gartner, a global research and advisory firm. Its nearest rival, SAP, trails significantly, with a market share of around 8%. About 90% of Fortune 100 companies use at least one Salesforce software product.
The company has leveraged its expertise in on-demand software to increase the scale of operations. It also offers a technology platform for customers and developers to build and run business applications. The company’s results are reported under a single operating segment.
Salesforce helps companies of all sizes and across industries connect with their customers in new ways through existing and emerging technologies, including cloud, mobile, social, IoT and artificial intelligence (AI).
Rapid digital transformation and the company’s sustained focus on aligning products with customer needs are driving the top line. Salesforce’s annual revenues have grown nearly eightfold from $5.4 billion in fiscal 2015 to $41.5 billion in fiscal 2026.
The company has two main revenue streams — Subscription and Support, and Professional Services and Other.
Subscription revenues (95% of FY26 revenues) comprise subscription fees from customers accessing the company’s enterprise cloud computing services (Cloud Services), software licenses and subscription fees recognized from customers for additional support.
Professional Services & Other revenues (5%) comprise fees generated from consulting, implementation services and training.

As of 09/15/2026
Reasons To Buy:
CRM Franchise: Salesforce remains the leading provider of cloud-based CRM, with a broad suite spanning sales, service, marketing, commerce, analytics and integration. Agentforce is embedded across the platform, extending that installed base into AI-led workflows. In the second quarter of fiscal 2027, Agentforce Sales, Service and Slack seats all grew year over year, while attrition was near its lowest level ever. Contract-length terms also increased across all segments for new business and renewals, supporting the platform’s cross-sell potential and customer stickiness.
SaaS Model and Recurring Revenues: Salesforce’s on-demand model supports standardized deployments, frequent updates and lower ownership costs for customers. In the second quarter of fiscal 2027, subscription and support revenues rose 12% year over year to $10.82 billion, while cRPO increased 14% to $33.5 billion and total RPO rose 11% to $66.3 billion. Management raised fiscal 2027 subscription and support growth guidance to slightly above 12% year over year and slightly under 12% in constant currency. Fiscal 2027 revenue guidance is now $46.1 billion to $46.4 billion, including acquisition contributions, while non-GAAP operating margin guidance remains at 34.3%. For the third quarter, the company expects cRPO growth of about 14% in constant currency, keeping the investment case centered on recurring bookings and profitable subscription growth.
AI and Agentforce Momentum: Salesforce is pushing generative and agentic AI deeper into its applications and tying adoption to measurable work. In the second quarter of fiscal 2027, Agentforce ARR exceeded $1.5 billion, up more than 240% year over year, while combined Agentforce and Data 360 ARR reached nearly $3.9 billion, up more than 210%. Effective in the quarter, Agentforce ARR includes Salesforce’s AI offerings, Slackbot and Headless 360. Customers generated 3.2 billion Agentic Work Units in the quarter, up 97% sequentially, bringing cumulative delivery to 7.0 billion. The number of accounts with agents in production rose 70% from the prior quarter, and bookings from Agentforce One Edition and Agentforce for Apps more than doubled sequentially. Data 360 ingested 104 trillion records, up 355% year over year, including 82 trillion through Zero Copy, up 731%. The company raised the organic component of fiscal 2027 revenue guidance by $100 million, citing Agentforce, Data 360 and Slack, and remains on track for second-half organic revenue reacceleration.
Portfolio Expansion Through M&A: Acquisitions remain a lever to fill product gaps and deepen the data, content and automation layers around Salesforce’s platform. Informatica contributed $456 million to second-quarter fiscal 2027 revenues, including $440 million of subscription and support revenues, while Informatica Cloud ARR remained part of the Data 360 base. Salesforce has also agreed to acquire Contentful for about $1.5 billion in cash and Fin for about $3.6 billion in cash. The company expects both transactions to be closed during the third quarter of fiscal 2027. The updated fiscal 2027 revenue outlook includes an expected $200 million contribution from Contentful and Fin. Over time, these assets can broaden content management, autonomous service and trusted data capabilities across the Agentforce platform.
Ecosystem Reach and Integrations: Salesforce’s strategy increasingly separates its data and application foundation from the interfaces customers use to access it. Headless 360 is designed to expose Salesforce through APIs and AI tools, allowing customers to embed governed data, metadata and workflows into external surfaces. In the second quarter of fiscal 2027, weekly calls to Salesforce’s MCP server grew six fold while human application usage remained stable. The company also stated that nine of the 10 AI companies use Salesforce and Slack, with their spending up 435% year over year. Broader interface access can deepen consumption without requiring customers to abandon existing Salesforce systems of record.
International Investment Path: Salesforce has ramped up investments in Europe, focusing on AI infrastructure, research and development, and local partnerships, with the U.K. serving as an AI hub for the region. In September 2025, the company announced a plan to invest $6 billion in its U.K. business by 2030, building on a prior $4 billion commitment made in 2023. The company also expanded in other parts of Europe, including opening an office in Amsterdam to support Agentforce adoption and maintaining key offices in Munich, Berlin and Dusseldorf, with data center capacity in Frankfurt to support compliance needs. The initiatives have supported higher European revenues over time. In fiscal 2026, Europe revenues increased 13% year over year and represented about 24% of total revenues. In the second quarter of fiscal 2027, Europe revenues rose 14% to $2.76 billion and represented more than 24% of total revenues, while Asia Pacific revenues increased 9% to $1.17 billion and represented 10%. Salesforce’s partnerships with large cloud providers, including Amazon and Alphabet, have also helped the company scale internationally and support secure data sharing across environments. Total second-quarter revenues increased 11% in both nominal and constant currency terms. A larger international footprint can diversify growth as customers adopt Agentforce and Data 360 beyond initial deployments.
Cash Flow and Shareholder Returns: Salesforce continues to generate cash that supports product investment and capital return. In the second quarter of fiscal 2027, operating cash flow increased 71% year over year to $1.27 billion and free cash flow rose 81% to $1.10 billion. For the first six months, operating cash flow reached $7.97 billion and free cash flow was $7.65 billion. The company paid $364 million of dividends in the second quarter and continued executing its $25 billion accelerated share repurchase. It expects the program to repurchase at least 14% of shares outstanding and expects final settlement in October 2026. Cash, cash equivalents and marketable securities totaled about $11.4 billion at July 31, 2026. Fiscal 2027 operating and free cash flow growth guidance remains approximately 4-5%.
Reasons To Sell:
Macro Sensitivity: Salesforce remains exposed to enterprise budget scrutiny and geopolitical uncertainty that can delay new projects and expansion. The company stated it remains on track for second-half organic revenue reacceleration, but fiscal 2027 guidance still reflects continued volatility in overall license revenues, leaving broader deployment timing important.
Competition and Pricing: Salesforce faces persistent competition from large platform vendors, including Microsoft and Oracle, which bundle adjacent products and can use pricing to gain market share. Competition can be acute in large enterprise suites where customers evaluate CRM alongside productivity, infrastructure and data tools. Management is expanding Agentforce and Data 360 to defend the platform, but rivals are also investing heavily in AI assistants and workflow automation. If Salesforce has to increase discounting or spend more on go-to-market to maintain share, the benefit from margin discipline could narrow over time. Microsoft continues to broaden Dynamics through assets such as LinkedIn and has used promotional pricing in the past to attract CRM customers. Oracle has strengthened its cloud position through acquisitions, while IBM competes across collaboration and enterprise software. The Microsoft-Adobe tie-up also raises the bar in sales and marketing workflows. These dynamics can raise churn risk at the margin and keep sales cycles longer, especially when customers are making platform decisions.
Higher Leverage and Interest Costs: Salesforce funded its $25 billion accelerated share repurchase with March 2026 debt issuance, leaving non-current debt at $39.3 billion as of July 31, 2026. Second-quarter interest expense rose to $473 million from $67 million a year earlier, while first-half interest expense reached $790 million versus $135 million. The company continues to forecast fiscal 2027 operating and free cash flow growth of about 4-5%. Higher financing costs reduce flexibility if demand weakens or acquisition needs rise.
Goodwill and Integration Risk: Salesforce’s acquisition strategy keeps goodwill elevated and adds execution demands. Goodwill was $59.3 billion as of July 31, 2026, more than half of total assets. Pending purchases of Contentful and Fin add about $5.1 billion of cash consideration. Integration delays or weaker performance from acquired products could slow margin improvement.
Last Earnings Report
Salesforce Q2 Earnings Beat on Investment Gains, Revenue View Raised
Salesforce reported second-quarter fiscal 2027 non-GAAP earnings of $5.90 per share, up 102.7% year over year. The bottom line beat the Zacks Consensus Estimate by 80.43%.
Revenues rose 10.8% year over year to $11.35 billion and topped the consensus mark by 0.25%. Growth reflected momentum in Slack, Agentforce and Informatica. Agentforce and Data 360 ARR reached nearly $3.9 billion, up more than 210% year over year.
CRM's Q2 Revenue Mix Shows Broad-Based Growth
Subscription and support revenues increased 11.7% year over year to $10.82 billion, including a $440 million contribution from Informatica. Professional services and other revenues declined 3.8% to $525 million.
Agentforce Apps generated $7.19 billion in subscription and support revenues, with constant-currency growth of 8%. Data 360, Headless Platform and Other contributed $3.62 billion and grew 20% in constant currency. Regionally, the Americas generated $7.4 billion, Europe $2.76 billion and Asia Pacific $1.17 billion, with constant-currency growth of 10%, 13% and 12%, respectively.
Current remaining performance obligation (cRPO) was $33.5 billion, up 14% year over year in constant currency. Total remaining performance obligation reached $66.3 billion, up 11%.
Salesforce's Agentic AI Usage Accelerates
Agentforce ARR exceeded $1.5 billion, rising more than 240% year over year. Customers completed 3.2 billion Agentic Work Units in the quarter, up 97% sequentially, taking cumulative volume across Agentforce and Slack to 7.0 billion.
Slack posted its fastest quarterly net new annual order value growth since the acquisition, while Slackbot users increased more than 150% quarter over quarter. Bookings from Agentforce One Edition and Agentforce for Apps more than doubled sequentially. Management also noted that first-half net new annual order value growth significantly outpaced annual order value growth.
Data 360 ingested 104 trillion records in the quarter, up 355% year over year. Zero Copy ingestion reached 82 trillion records, up 731%, underscoring the rising usage of the company's data layer alongside its agentic products.
CRM's Profitability Reflects Investment Gains
Non-GAAP operating income increased 10.3% year over year to $3.87 billion. The non-GAAP operating margin was 34.1%, down 20 basis points, while the GAAP operating margin fell 230 basis points to 20.5%. Non-GAAP cost of revenues rose to 20% of revenues from 19%, while general and administrative expenses declined to 5% from 6%.
Net gains on strategic investments totaled $2.61 billion compared with $6 million a year earlier. These gains contributed $2.53 per share to second-quarter non-GAAP earnings, providing a substantial boost to the quarter's bottom-line performance.
Salesforce's Cash Flow and Capital Return
In the second quarter, operating cash flow jumped 71.5% year over year to $1.27 billion, while free cash flow increased 81.5% to $1.10 billion. In the first half of fiscal 2027, the company generated operating and free cash flows of $7.97 billion and $7.65 billion, respectively. Salesforce ended the second quarter with $8.31 billion in cash and cash equivalents and $3.09 billion in marketable securities.
The company returned $364 million through dividends during the quarter and continued executing its $25 billion accelerated share repurchase program. Through the first half of fiscal 2027, capital returns totaled $27.9 billion. The share count was down 141 million shares, or 15%, year over year.
CRM Raises Fiscal 2027 Revenue Outlook
Salesforce raised its fiscal 2027 revenue guidance to $46.10-$46.40 billion from $45.90-$46.20 billion. The $200 million increase, or $300 million in constant currency, reflects $100 million of organic growth and $200 million tied to the pending Contentful and Fin acquisitions, partly offset by a $100 million foreign-exchange headwind. Non-GAAP operating margin guidance remains at 34.3%.
Salesforce lifted its fiscal 2027 non-GAAP earnings outlook to $16.67-$16.71 per share from $14.06-$14.12. It continues to expect operating cash flow and free cash flow growth of approximately 4%-5% year over year. Updated guidance incorporates the anticipated contributions from Contentful and Fin and is conditional upon the transactions closing.
For the third quarter of fiscal 2027, CRM expects revenues of $11.42-$11.50 billion, implying 11%-12% year-over-year growth, and non-GAAP earnings of $3.42-$3.44 per share. The company expects cRPO growth of approximately 14% year over year and in constant currency.
Recent News
On Aug. 26, Salesforce and Anthropic announced an expansion of their partnership. The collaboration will combine Claude’s reasoning capabilities with the Salesforce platform’s data, workflows, business logic, actions and governance to enable trusted enterprise action directly within Claude.
On July 24, Salesforce secured a $1.6 billion contract from the U.S. Department of Veterans Affairs to deploy Missionforce and modernize veteran care and service delivery.
On July 8, Salesforce announced that the U.S. Air Force deployed Missionforce National Security to modernize fleet logistics and operations for its $13.5 billion vehicle fleet.
On June 25, Salesforce granted equity awards to employees joining from its acquisition of Momentum under its Inducement Equity Incentive Plan.
On June 22, Salesforce partnered with Visa Cash App Racing Bulls Formula One Team to deploy Agentforce 360, using AI to enhance fan engagement, hospitality and race-day operations.
On June 15, Salesforce signed a definitive agreement to acquire Fin for approximately $3.6 billion, expanding its autonomous AI agent capabilities for customer service across enterprises.
On June 5, Salesforce became an Official Tournament Supporter of the 2026 FIFA World Cup and the 2027 FIFA Women's World Cup, providing its Agentforce 360 platform and Slack to support AI-driven fan engagement and tournament operations.
On May 28, Salesforce's board of directors declared the quarterly cash dividend of 44 cents per share, which will be payable on July 2 to shareholders of record on June 11.
On May 22, Salesforce announced that it has granted equity awards under its 2014 Inducement Equity Incentive Plan to new employees who joined the company in connection with the acquisition of Cimulate.
On May 6, Merck Animal Health selected Salesforce Agentforce Life Sciences to improve customer engagement and support experiences across animal care channels.
Valuation
Salesforce shares are up 33.5% over the past three months but down 1% over the past year. Within the Zacks sub-industry, stocks are up 2.2% over the past three months, while the Zacks Computer and Technology sector is down 3.4% over the same period. Over the past year, the Zacks sub-industry is down 20.4%, while the sector is up 28.4%. The S&P 500 index is up 1.9% over the past three months and 18.9% over the past year.
The stock is trading at 4.25X forward 12-month sales per share, compared with 3.97X for the Zacks sub-industry, 6.31X for the Zacks sector, and 4.92X for the S&P 500 index. Over the past five years, the stock has traded as high as 9.96X and as low as 2.57X, with a five-year median of 5.72X.
Our Neutral recommendation indicates the stock will likely perform in line with the market. Our $265 price target reflects a 4.46x forward 12-month sales multiple.
The table below shows summary valuation data for CRM.

Industry Analysis(1)
Zacks Industry Rank: Top 36% (90 out of 247)

Top Peers (1)
| Company (Ticker) | Rec | Rank |
|---|---|---|
| Adobe Inc. (ADBE) | Neutral |
3
|
| Intuit Inc. (INTU) | Neutral |
3
|
| Microsoft Corporatio… (MSFT) | Neutral |
3
|
| Oracle Corporation (ORCL) | Neutral |
3
|
| SAP SE (SAP) | Neutral |
3
|
| Synopsys, Inc. (SNPS) | Neutral |
2
|
| SS&C Technologies Ho… (SSNC) | Neutral |
3
|
| Open Text Corporatio… (OTEX) | Underperform |
5
|
Industry Comparison(1)Industry: Internet - Software |
Industry Peers |
|||||
|---|---|---|---|---|---|---|
| CRM | X Industry | S&P 500 | ADBE | ORCL | SAP | |
| Zacks Recommendation (Long Term) | Neutral | - | - | Neutral | Neutral | Neutral |
| Zacks Rank (Short Term) | 3 |
- | - | 3 | 3 | 3 |
| VGM Score | B |
- | - | A | A | C |
| Market Cap | 210.40 B | 827.52 M | 44.39 B | 102.46 B | 424.38 B | 264.95 B |
| # of Analysts | 20 | 3 | 22 | 16 | 18 | 10 |
| Dividend Yield | 0.69% | 0.00% | 1.42% | 0.00% | 1.42% | 0.99% |
| Value Score | C |
- | - | B | B | D |
| Cash/Price | 0.06 | 0.15 | 0.04 | 0.06 | 0.09 | 0.05 |
| EV/EBITDA | 15.53 | 7.75 | 14.02 | 10.35 | 15.25 | 17.83 |
| PEG Ratio | 1.58 | 1.14 | 1.79 | 0.74 | 0.82 | 2.57 |
| Price/Book (P/B) | 5.48 | 3.21 | 3.58 | 8.71 | 6.82 | 5.04 |
| Price/Cash Flow (P/CF) | 15.63 | 20.10 | 14.64 | 13.22 | 14.55 | 27.63 |
| P/E (F1) | 17.68 | 20.36 | 17.89 | 10.54 | 17.34 | 26.38 |
| Price/Sales (P/S) | 4.79 | 2.86 | 2.97 | 3.95 | 5.91 | 5.95 |
| Earnings Yield | 6.38% | 4.02% | 5.54% | 9.49% | 5.77% | 3.79% |
| Debt/Equity | 1.02 | 0.01 | 0.56 | 0.41 | 1.89 | 0.19 |
| Cash Flow ($/share) | 16.36 | 0.27 | 9.70 | 19.50 | 9.64 | 7.81 |
| Growth Score | B |
- | - | B | A | C |
| Hist. EPS Growth (3-5 yrs) | 47.89% | 19.15% | 7.04% | 14.39% | 9.03% | 14.04% |
| Proj. EPS Growth (F1/F0) | 30.27% | 43.23% | 12.54% | 16.81% | 6.16% | 17.53% |
| Curr. Cash Flow Growth | 13.90% | 9.60% | 8.27% | 8.05% | 47.88% | 35.09% |
| Hist. Cash Flow Growth (3-5 yrs) | 19.13% | 18.05% | 9.21% | 10.61% | 12.38% | 3.29% |
| Current Ratio | 0.84 | 1.55 | 1.18 | 0.77 | 1.17 | 1.15 |
| Debt/Capital | 50.59% | 3.98% | 37.14% | 28.83% | 63.66% | 15.88% |
| Net Margin | 21.99% | 0.65% | 12.94% | 28.05% | 26.36% | 20.88% |
| Return on Equity | 24.90% | 3.95% | 17.70% | 65.65% | 48.85% | 17.07% |
| Sales/Assets | 0.41 | 0.62 | 0.54 | 0.87 | 0.28 | 0.53 |
| Proj. Sales Growth (F1/F0) | 11.40% | 7.95% | 7.36% | 11.90% | 34.10% | 10.80% |
| Momentum Score | B |
- | - | A | A | B |
| Daily Price Chg | -1.46% | -0.81% | -0.45% | -2.95% | -3.07% | -1.20% |
| 1 Week Price Chg | -4.44% | -3.15% | -1.14% | -5.36% | -5.35% | -4.07% |
| 4 Week Price Chg | 30.34% | -2.29% | -1.38% | -2.04% | -1.71% | 2.47% |
| 12 Week Price Chg | 66.63% | 4.42% | 2.99% | 30.56% | -15.02% | 40.61% |
| 52 Week Price Chg | 6.83% | -25.75% | 14.82% | -26.92% | -54.23% | -14.96% |
| 20 Day Average Volume | 15,852,149 | 546,406 | 2,601,535 | 4,912,048 | 27,326,144 | 2,133,544 |
| (F1) EPS Est 1 week change | 0.00% | 0.00% | 0.00% | 0.87% | 1.75% | 0.00% |
| (F1) EPS Est 4 week change | 24.92% | 0.00% | 0.00% | 0.87% | 2.06% | 0.53% |
| (F1) EPS Est 12 week change | 24.61% | 2.41% | 1.08% | 0.87% | 2.52% | -2.19% |
| (Q1) EPS Est Mthly Chg | 3.95% | 0.00% | 0.00% | 0.11% | 3.19% | 0.28% |
Zacks Stock Rating System
We offer two rating systems that take into account investors' holding horizons: Zacks Rank and Zacks Recommendation. Each provides valuable insights into the future profitability of the stock and can be used separately or in combination with each other depending on your investment style.
Zacks Recommendation
The Zacks Recommendation aims to predict performance over the next 6 to 12 months. The foundation for the quantitatively determined Zacks Recommendation is trends in the company's estimate revisions and earnings outlook. The Zacks Recommendation is broken down into 3 Levels; Outperform, Neutral and Underperform. Unlike many Wall Street firms, we have an excellent balance between the number of Outperform and Neutral recommendations. Our team of 70 analysts are fully versed in the benefits of earnings estimate revisions and how that is harnessed through the Zacks quantitative rating system. But we have given our analysts the ability to override the Zacks Recommendation for the 1200 stocks that they follow. The reason for the analyst over-rides is that there are often factors such as valuation, industry conditions and management effectiveness that a trained investment professional can spot better than a quantitative model.
Zacks Rank
The Zacks Rank is our short-term rating system that is most effective over the one- to three-month holding horizon. The underlying driver for the quantitatively-determined Zacks Rank is the same as the Zacks Recommendation, and reflects trends in earnings estimate revisions.
Zacks Style Scores
The Zacks Style Score is as a complementary indicator to the Zacks rating system, giving investors a way to focus on the highest rated stocks that best fit their own stock picking preferences.
Academic research has proven that stocks with the best Value, Growth and Momentum characteristics outperform the market. The Zacks Style Scores rate stocks on each of these individual styles and assigns a rating of A, B, C, D and F. We also produce the VGM Score (V for Value, G for Growth and M for Momentum), which combines the weighted average of the individual Style Scores into one score. This is perfectly suited for those who want their stocks to have the best scores across the board.
As an investor, you want to buy stocks with the highest probability of success. That means buying stocks with a Zacks Recommendation of Outperform, which also has a Style Score of an A or a B.
Disclosures
This report contains independent commentary to be used for informational purposes only. The analysts contributing to this report do not hold any shares of this stock. The analysts contributing to this report do not serve on the board of the company that issued this stock. The EPS and revenue forecasts are the Zacks Consensus estimates, unless otherwise indicated in the report's first-page footnote. Additionally, the analysts contributing to this report certify that the views expressed herein accurately reflect the analysts' personal views as to the subject securities and issuers. ZIR certifies that no part of the analysts' compensation was, is, or will be, directly or indirectly, related to the specific recommendation or views expressed by the analyst in the report.
Additional information on the securities mentioned in this report is available upon request. This report is based on data obtained from sources we believe to be reliable, but is not guaranteed as to accuracy and does not purport to be complete. Any opinions expressed herein are subject to change.
ZIR is not an investment advisor and the report should not be construed as advice designed to meet the particular investment needs of any investor. Prior to making any investment decision, you are advised to consult with your broker, investment advisor, or other appropriate tax or financial professional to determine the suitability of any investment. This report and others like it are published regularly and not in response to episodic market activity or events affecting the securities industry.
This report is not to be construed as an offer or the solicitation of an offer to buy or sell the securities herein mentioned. ZIR or its officers, employees or customers may have a position long or short in the securities mentioned and buy or sell the securities from time to time. ZIR is not a broker-dealer. ZIR may enter into arms-length agreements with broker-dealers to provide this research to their clients. Zacks and its staff are not involved in investment banking activities for the stock issuer covered in this report.
ZIR uses the following rating system for the securities it covers. Outperform- ZIR expects that the subject company will outperform the broader U.S. equities markets over the next six to twelve months. Neutral- ZIR expects that the company will perform in line with the broader U.S. equities markets over the next six to twelve months. Underperform- ZIR expects the company will underperform the broader U.S. equities markets over the next six to twelve months.
No part of this report can be reprinted, republished or transmitted electronically without the prior written authorization of ZIR.