This is an excerpt from our most recent Economic Outlook report. To access the full PDF, please click here.
I. U.S. Net Worth
Wealth keeps accumulating for heavily-invested U.S. households, keeping up net worth support for this resilient U.S. economy.
As to Household Net Worth levels? The most recent Q4-2023 level found on FRED was $147T. This surpassed a prior COVID high of $143.7T seen in Q1-2022.
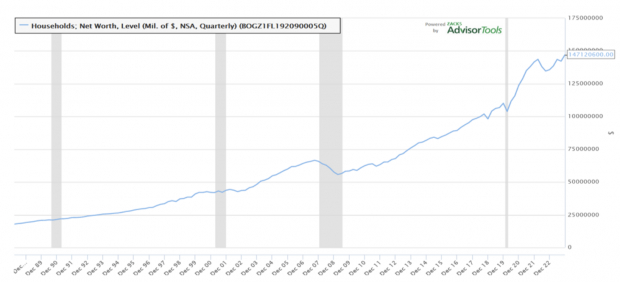
Image Source: Zacks Investment Research
Recent March 7th, 2024 data on FRED also shows: $113.6T in Total Household Financial Assets in the USA. With a recent stock market rally, this too slipped over a prior Q4-2021 high of $113.4T.

Image Source: Zacks Investment Research
Finally, Household Owner’s Equity in Real Estate? The recent Q4-2023 data shows this source of wealth has recovered to $31.8T. This is just under the prior peak was $32.5T seen in Q2-2022.
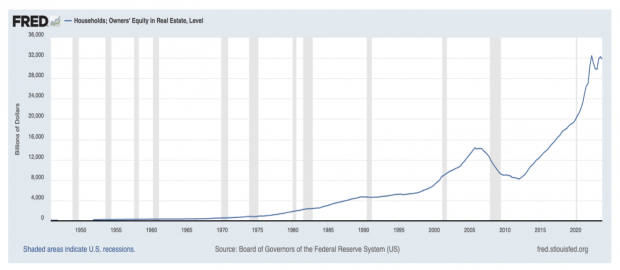
Image Source: St Louis Federal Reserve
So, for the depleted U.S. savings narrative?
One needs to look to U.S. households without significant stock ownership, or home investments.
That would be the younger generations.
Along with a need to focus on the wealth accumulation struggles of younger generations?
Consider this narrative provided by the global consultancy McKinsey…
II. “Two Decades of Growing Paper Wealth”
A. From McKinsey: The Future of Wealth and Growth Hangs in the Balance.
I excerpted a sub-section titled: “Two decades of growing ‘paper wealth’ but slow economic growth”:
https://www.mckinsey.com/mgi/overview/the-future-of-wealth-and-growth-hangs-in-the-balance#paper-wealth
“The past two decades stand in marked contrast to the post–World War II historical trajectory of global wealth (and debt) accumulation.”
“Before the turn of the millennium, growth in global net worth largely tracked GDP growth.”
“But then something unusual happened. Around the year 2000, with timing that varied by country, net worth, asset values, and debt began growing significantly faster than GDP.”
“In contrast, productivity growth among G-7 countries has been sluggish, falling from 1.8 percent per year between 1980 and 2000 to 0.8 percent from 2000 to 2018.”
“Between 2000 and 2021, asset price inflation created about $160 trillion in ‘paper wealth.’”
“Valuations of assets like equity and real estate grew faster than real economic output. And each $1.00 in net investment generated $1.90 in net new debt.”
“In aggregate, the global balance sheet grew 1.3 times faster than GDP. It quadrupled to reach $1.6 quintillion in assets, consisting of
- $610 trillion in real assets
- $520 trillion in financial assets outside the financial sector, and
- $500 trillion within the financial sector”
“Balance sheet expansion accelerated during the pandemic as governments launched large-scale support for households and businesses affected by lockdowns.”
“During 2020 and 2021, global wealth relative to GDP grew faster than in any other two-year period in the past 50 years. The creation of new debt accelerated to $3.40 for each $1.00 in net investment.”
“A structural decline in real interest rates underpinned the expansion of the balance sheet, all while economic growth remained sluggish. For example, in the United States, forward-looking expectations for real interest rates steadily declined between 1995 and 2021.”
“Low interest rates encouraged borrowing, lowering the cost of loans and bonds and spurring commercial banks to collect—and create—deposits.”
“In highly simplified terms, an overhang of capital chased too few productive investment opportunities, and much of it flowed to real estate and equity, driving up prices.”
“Debt rose faster than net investment, and paper wealth grew.”
B. Summary Thoughts
So, this has been a historic, 24-year-long paper wealth expansion.
Household financial assets were seen expanding globally, with U.S. balance sheet leadership.
So too was the creation of new, mostly government debt:
- $1.00 in net investment came with $1.90 in net new debt, from 2000 to 2021
- With $3.40 in net new debt for each $1.00 in net investment, during the COVID period
There is good news to find out on debt accumulations, though!


Image: Bigstock
Will Swallowing This 'Paper Wealth' Pig End Badly?
This is an excerpt from our most recent Economic Outlook report. To access the full PDF, please click here.
I. U.S. Net Worth
Wealth keeps accumulating for heavily-invested U.S. households, keeping up net worth support for this resilient U.S. economy.
As to Household Net Worth levels? The most recent Q4-2023 level found on FRED was $147T. This surpassed a prior COVID high of $143.7T seen in Q1-2022.
Image Source: Zacks Investment Research
Recent March 7th, 2024 data on FRED also shows: $113.6T in Total Household Financial Assets in the USA. With a recent stock market rally, this too slipped over a prior Q4-2021 high of $113.4T.
Image Source: Zacks Investment Research
Finally, Household Owner’s Equity in Real Estate? The recent Q4-2023 data shows this source of wealth has recovered to $31.8T. This is just under the prior peak was $32.5T seen in Q2-2022.
Image Source: St Louis Federal Reserve
So, for the depleted U.S. savings narrative?
One needs to look to U.S. households without significant stock ownership, or home investments.
That would be the younger generations.
Along with a need to focus on the wealth accumulation struggles of younger generations?
Consider this narrative provided by the global consultancy McKinsey…
II. “Two Decades of Growing Paper Wealth”
A. From McKinsey: The Future of Wealth and Growth Hangs in the Balance.
I excerpted a sub-section titled: “Two decades of growing ‘paper wealth’ but slow economic growth”:
https://www.mckinsey.com/mgi/overview/the-future-of-wealth-and-growth-hangs-in-the-balance#paper-wealth
“The past two decades stand in marked contrast to the post–World War II historical trajectory of global wealth (and debt) accumulation.”
“Before the turn of the millennium, growth in global net worth largely tracked GDP growth.”
“But then something unusual happened. Around the year 2000, with timing that varied by country, net worth, asset values, and debt began growing significantly faster than GDP.”
“In contrast, productivity growth among G-7 countries has been sluggish, falling from 1.8 percent per year between 1980 and 2000 to 0.8 percent from 2000 to 2018.”
“Between 2000 and 2021, asset price inflation created about $160 trillion in ‘paper wealth.’”
“Valuations of assets like equity and real estate grew faster than real economic output. And each $1.00 in net investment generated $1.90 in net new debt.”
“In aggregate, the global balance sheet grew 1.3 times faster than GDP. It quadrupled to reach $1.6 quintillion in assets, consisting of
“Balance sheet expansion accelerated during the pandemic as governments launched large-scale support for households and businesses affected by lockdowns.”
“During 2020 and 2021, global wealth relative to GDP grew faster than in any other two-year period in the past 50 years. The creation of new debt accelerated to $3.40 for each $1.00 in net investment.”
“A structural decline in real interest rates underpinned the expansion of the balance sheet, all while economic growth remained sluggish. For example, in the United States, forward-looking expectations for real interest rates steadily declined between 1995 and 2021.”
“Low interest rates encouraged borrowing, lowering the cost of loans and bonds and spurring commercial banks to collect—and create—deposits.”
“In highly simplified terms, an overhang of capital chased too few productive investment opportunities, and much of it flowed to real estate and equity, driving up prices.”
“Debt rose faster than net investment, and paper wealth grew.”
B. Summary Thoughts
So, this has been a historic, 24-year-long paper wealth expansion.
Household financial assets were seen expanding globally, with U.S. balance sheet leadership.
So too was the creation of new, mostly government debt:
There is good news to find out on debt accumulations, though!