This is an excerpt from our most recent Economic Outlook report. To access the full PDF, please click here.
This month’s special topic is U.S. Consumer Price Inflation. The reasons for focusing on this may seem obvious, to all of the savvy readers of this Zacks publication. But perhaps it is best to more formally state the official reasoning up front.
I pulled this opening paragraph from the Federal Reserve’s own website, to make sure we begin this thread with the exact and proper statutory framework, on what is commonly known as ‘the dual mandate.’
I. What are the goals of U.S. Federal Reserve monetary policy?
The Federal Reserve Act mandates that the Federal Reserve conduct monetary policy "so as to promote effectively the goals of maximum employment, stable prices, and moderate long-term interest rates."
Even though the act lists three distinct goals of monetary policy, the Fed's mandate for monetary policy is commonly known as the dual mandate.
The reason is that an economy in which people who want to work either have a job or are likely to find one fairly quickly and in which the price level (meaning a broad measure of the price of goods and services purchased by consumers) is stable creates the conditions needed for interest rates to settle at moderate levels.
Since the U.S. economy — for 23 consecutive months, from March 2022 to January 2024 — has kept a very low and stable range of 3.4% to 3.8% household unemployment rates, their sole immediate goal is “stable prices,” ones that produce “moderate long-term interest rates.”
And lately, the Fed has become very successful at this. The bond market has been very forward-looking, and is fully betting the FOMC is going to nail the soft-landing in 2024, with a stretch of dis-inflating goods helping lower the overall levels of price inflation experienced by the U.S. economy, since the end of the COVID pandemic.
But what do the facts show us? That is the key topic we are going to take up in this special opening Jan. 2024 comment.
II. The U.S. Core and Broad CPI Timeline
First up, let’s review the percent change from a year ago data, for both the core All Items in U.S. City Average CPI (blue) aligned with the broad All Items Less Food and Energy in U.S. City Average CPI (red). The two data series are shown in the chart below, in alignment from the late 1940s post-WWII era, to the present moment of Jan. 2024.
The FOMC has taken the broad CPI measure down 63% (nearly 2/3rds) in 19 months of time:
- The broad CPI peaked at 8.93% y/y in June 2022, three months after the Fed achieved full employment in this re-opening business cycle. This is 3.30% entering 2024.
- The core CPI peaked at 6.63% y/y in Sept. 2022. This is 3.90% entering 2024.
- The broad CPI is already back below 2005 levels (with low gasoline prices providing a big assist. The core CPI (with more concentration of home shelter costs, remains elevated above that prior 2005 level.
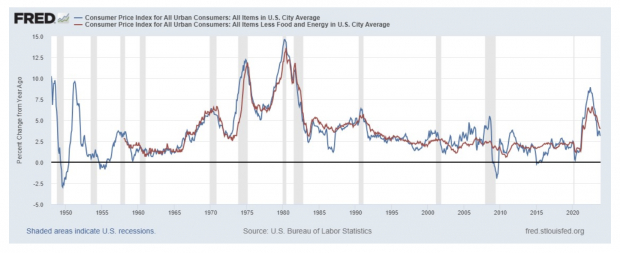
Image Source: Zacks Investment Research
In the timeline above, the highest core CPI was reached on June 1980 at 13.59% y/y. I looked into news headlines written at that time. I found this downward macro price catalyst:
“The U.S. Senate voted, 68 to 10, to override President Carter's veto of a bill banning a 10 cent per gallon tax on gasoline announced by Carter in March, and poised to take effect on July 1st, 1980. The day before, the U.S. House of Representatives had voted, 335 to 34, to override the veto, and the Senate's action banned the fee and marked the first time since 1952 that a Democrat-controlled Congress had overridden a Democrat U.S. president. On June 4th, 1980 both houses of Congress had voted overwhelmingly (367 to 30 and 73 to 16) to pass the measure that Carter vetoed.” These were the early days of the Iranian Cultural Revolution.
That core CPI hit bottom at 2.93% in July 1983; at 2.91% 36 months later.
If history rhymes with this President Carter-era core CPI experience, the U.S. economy will continue to dis-inflate consumer price for the next 12 months, and the process will bottom sometime in early 2025.
There are major differences between these eras, of course. Below, I break out the CPIs for Used Cars and Trucks (green), Rent of Primary Residence (blue) and All Items Less Food and Energy (red).
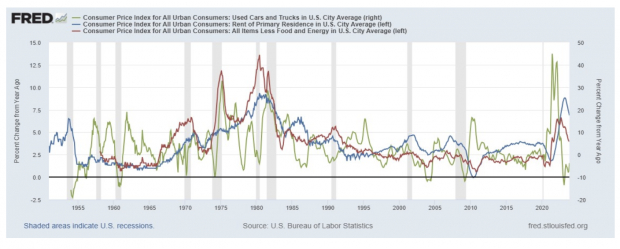
Image Source: Zacks Investment Research
- The global supply chain shock is captured by Used Car and Truck CPI. This peaked at +44.9% y/y in June 2021. It bottomed at -13.58% in Feb. 2023, 20 months later.
- The Rent of Primary Residence CPI peaked at +8.80% y/y in April 2023. That key components’ decline is what primarily remains in play for 2024.


Image: Bigstock
The U.S. Experience with Supply Shock Inflation
This is an excerpt from our most recent Economic Outlook report. To access the full PDF, please click here.
This month’s special topic is U.S. Consumer Price Inflation. The reasons for focusing on this may seem obvious, to all of the savvy readers of this Zacks publication. But perhaps it is best to more formally state the official reasoning up front.
I pulled this opening paragraph from the Federal Reserve’s own website, to make sure we begin this thread with the exact and proper statutory framework, on what is commonly known as ‘the dual mandate.’
I. What are the goals of U.S. Federal Reserve monetary policy?
The Federal Reserve Act mandates that the Federal Reserve conduct monetary policy "so as to promote effectively the goals of maximum employment, stable prices, and moderate long-term interest rates."
Even though the act lists three distinct goals of monetary policy, the Fed's mandate for monetary policy is commonly known as the dual mandate.
The reason is that an economy in which people who want to work either have a job or are likely to find one fairly quickly and in which the price level (meaning a broad measure of the price of goods and services purchased by consumers) is stable creates the conditions needed for interest rates to settle at moderate levels.
Since the U.S. economy — for 23 consecutive months, from March 2022 to January 2024 — has kept a very low and stable range of 3.4% to 3.8% household unemployment rates, their sole immediate goal is “stable prices,” ones that produce “moderate long-term interest rates.”
And lately, the Fed has become very successful at this. The bond market has been very forward-looking, and is fully betting the FOMC is going to nail the soft-landing in 2024, with a stretch of dis-inflating goods helping lower the overall levels of price inflation experienced by the U.S. economy, since the end of the COVID pandemic.
But what do the facts show us? That is the key topic we are going to take up in this special opening Jan. 2024 comment.
II. The U.S. Core and Broad CPI Timeline
First up, let’s review the percent change from a year ago data, for both the core All Items in U.S. City Average CPI (blue) aligned with the broad All Items Less Food and Energy in U.S. City Average CPI (red). The two data series are shown in the chart below, in alignment from the late 1940s post-WWII era, to the present moment of Jan. 2024.
The FOMC has taken the broad CPI measure down 63% (nearly 2/3rds) in 19 months of time:
Image Source: Zacks Investment Research
In the timeline above, the highest core CPI was reached on June 1980 at 13.59% y/y. I looked into news headlines written at that time. I found this downward macro price catalyst:
“The U.S. Senate voted, 68 to 10, to override President Carter's veto of a bill banning a 10 cent per gallon tax on gasoline announced by Carter in March, and poised to take effect on July 1st, 1980. The day before, the U.S. House of Representatives had voted, 335 to 34, to override the veto, and the Senate's action banned the fee and marked the first time since 1952 that a Democrat-controlled Congress had overridden a Democrat U.S. president. On June 4th, 1980 both houses of Congress had voted overwhelmingly (367 to 30 and 73 to 16) to pass the measure that Carter vetoed.” These were the early days of the Iranian Cultural Revolution.
That core CPI hit bottom at 2.93% in July 1983; at 2.91% 36 months later.
If history rhymes with this President Carter-era core CPI experience, the U.S. economy will continue to dis-inflate consumer price for the next 12 months, and the process will bottom sometime in early 2025.
There are major differences between these eras, of course. Below, I break out the CPIs for Used Cars and Trucks (green), Rent of Primary Residence (blue) and All Items Less Food and Energy (red).
Image Source: Zacks Investment Research