“Simplicity is the Ultimate Sophistication” ~ Leonardo da Vinci
The above quote holds significant relevance on Wall Street and in the investing field. In financial markets, this concept emphasizes the importance of simplicity and straightforwardness in trading strategies and analysis.
Avoid Paralysis by Analysis
In my two decades of investing experience, I have found that having a few simple go-to indicators far supersedes having complex and overcomplicated indicators for several reasons:
1. Consistency: Simple indicators are easier to interpret consistently over time. Conversely, complex models may involve numerous variables and parameters, making it challenging to maintain a consistent approach. Inconsistent interpretation can lead to erratic decision-making and poor investment choices.
2. Discipline: Simple indicators contribute to stronger discipline in trading. Traders and investors relying on a straightforward set of indicators are likelier to stick to their strategies and avoid impulsive decisions.
3. Clarity: Simple indicators provide precise signals, making it easier for investors to understand and act upon market information. Meanwhile, complex models introduce ambiguity and lead to confusion.
4. Ease of Implementation: Simple indicators are generally easier to implement in practice because traders can quickly grasp the information they provide and incorporate it into their decision-making processes.
5. Robustness: Simple indicators are often more robust across various market conditions, allowing for adaptability and a more reliable performance across different market scenarios.
Below are five of my favorite go-to indicators to gauge market health:
Nasdaq McClellan Summation Index ($NASI)
The McClellan Oscillator is a market breadth indicator designed to analyze the advancing and declining issues in the stock market. It is calculated by taking the difference between the 39-day exponential moving average (EMA) and the 19-day EMA of the daily net advances.
Interpretation: When the faster 10-EMA crosses below the slower 39-day EMA, investors should be cautious, and vice versa. The beauty of the NASI is that there are very few signals, but they tend to be meaningful.
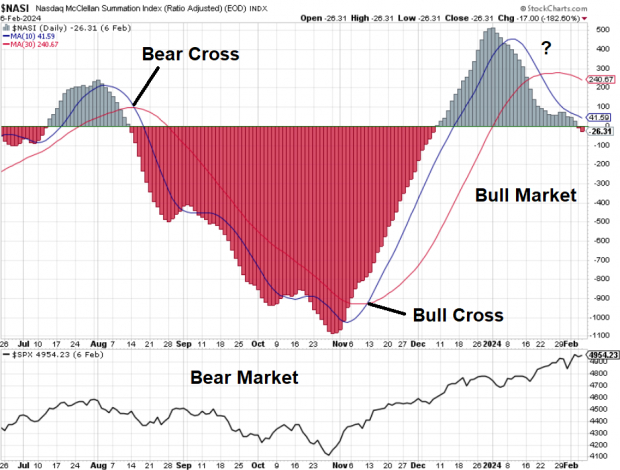
Image Source: StockCharts.com
CNN Fear & Greed Index
The CNN Fear and Greed Index is a sentiment gauge for the financial markets. Fear & Greed combines seven indicators to create a composite indication of the market between “extreme greed” and “extreme fear.”
Interpretation: When the crowd is concentrated on one side of the market, it is often wrong. Fade the extremes. Over the past year, the indicator successfully called intermediate bottoms in March and October 2023 and an intermediate top in July 2023.
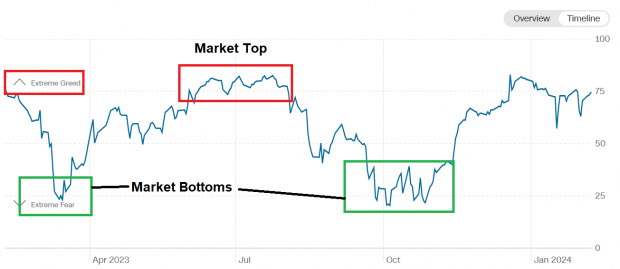
Image Source: CNN
Net New Highs – Lows
The net new high-low indicator measures the difference between the number of stocks reaching new highs and those reaching new lows, providing insights into market strength and potential shifts in investors’ sentiment.
Interpretation: This indicator divulges to investors how strong the market is beneath the hood. Environments where net new highs are dominating are ideal for being long stocks.

Image Source: Zacks Investment Research
Presidential Election Cycle Seasonality
Presidential Election Cycle Seasonality simply takes a historical composite of what stock prices have done at different times. Over the past few years, stocks have followed the seasonality roadmap closely.
Interpretation: Though seasonality is not a signal in itself, it can help investors know when the odds are stacked in their favor and when they should take their foot off the gas petal.
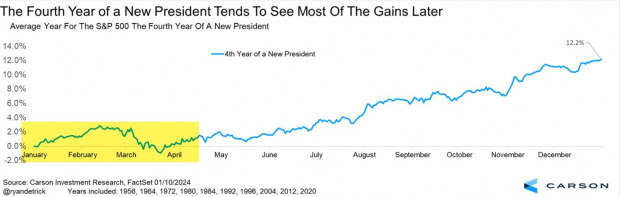
Image Source: Zacks Investment Research
200-Day Moving Average
The 200-day moving average is as simple as it comes: the 200-day is a significant long-term trend indicator, smoothing out short-term fluctuations and helping traders assess the overall direction of an asset’s price movement.
Interpretation: Legendary billionaire Paul Tudor Jones explained it best: “My metric for everything I look at is the 200-day moving average of closing prices. I’ve seen too many things go to zero, stocks and commodities. The whole trick in investing is: “How do I keep from losing everything? If you use the 200-day moving average rule, then you get out. You play defense, and you get out.” PTJ should know – not only did he avoid the “Black Monday” crash of 1987, but he made the bulk of his fortune being short the market.

Image Source: StockCharts.com
Bottom Line
The importance of simplicity in trading strategies and analysis should not be understated. A few straightforward indicators can provide investors consistency, discipline, clarity, ease of implementation, and robustness.
Image: Bigstock
5 Simple Indicators to Gauge Market Health (Avoid Paralysis by Analysis)
“Simplicity is the Ultimate Sophistication” ~ Leonardo da Vinci
The above quote holds significant relevance on Wall Street and in the investing field. In financial markets, this concept emphasizes the importance of simplicity and straightforwardness in trading strategies and analysis.
Avoid Paralysis by Analysis
In my two decades of investing experience, I have found that having a few simple go-to indicators far supersedes having complex and overcomplicated indicators for several reasons:
1. Consistency: Simple indicators are easier to interpret consistently over time. Conversely, complex models may involve numerous variables and parameters, making it challenging to maintain a consistent approach. Inconsistent interpretation can lead to erratic decision-making and poor investment choices.
2. Discipline: Simple indicators contribute to stronger discipline in trading. Traders and investors relying on a straightforward set of indicators are likelier to stick to their strategies and avoid impulsive decisions.
3. Clarity: Simple indicators provide precise signals, making it easier for investors to understand and act upon market information. Meanwhile, complex models introduce ambiguity and lead to confusion.
4. Ease of Implementation: Simple indicators are generally easier to implement in practice because traders can quickly grasp the information they provide and incorporate it into their decision-making processes.
5. Robustness: Simple indicators are often more robust across various market conditions, allowing for adaptability and a more reliable performance across different market scenarios.
Below are five of my favorite go-to indicators to gauge market health:
Nasdaq McClellan Summation Index ($NASI)
The McClellan Oscillator is a market breadth indicator designed to analyze the advancing and declining issues in the stock market. It is calculated by taking the difference between the 39-day exponential moving average (EMA) and the 19-day EMA of the daily net advances.
Interpretation: When the faster 10-EMA crosses below the slower 39-day EMA, investors should be cautious, and vice versa. The beauty of the NASI is that there are very few signals, but they tend to be meaningful.
Image Source: StockCharts.com
CNN Fear & Greed Index
The CNN Fear and Greed Index is a sentiment gauge for the financial markets. Fear & Greed combines seven indicators to create a composite indication of the market between “extreme greed” and “extreme fear.”
Interpretation: When the crowd is concentrated on one side of the market, it is often wrong. Fade the extremes. Over the past year, the indicator successfully called intermediate bottoms in March and October 2023 and an intermediate top in July 2023.
Image Source: CNN
Net New Highs – Lows
The net new high-low indicator measures the difference between the number of stocks reaching new highs and those reaching new lows, providing insights into market strength and potential shifts in investors’ sentiment.
Interpretation: This indicator divulges to investors how strong the market is beneath the hood. Environments where net new highs are dominating are ideal for being long stocks.
Image Source: Zacks Investment Research
Presidential Election Cycle Seasonality
Presidential Election Cycle Seasonality simply takes a historical composite of what stock prices have done at different times. Over the past few years, stocks have followed the seasonality roadmap closely.
Interpretation: Though seasonality is not a signal in itself, it can help investors know when the odds are stacked in their favor and when they should take their foot off the gas petal.
Image Source: Zacks Investment Research
200-Day Moving Average
The 200-day moving average is as simple as it comes: the 200-day is a significant long-term trend indicator, smoothing out short-term fluctuations and helping traders assess the overall direction of an asset’s price movement.
Interpretation: Legendary billionaire Paul Tudor Jones explained it best: “My metric for everything I look at is the 200-day moving average of closing prices. I’ve seen too many things go to zero, stocks and commodities. The whole trick in investing is: “How do I keep from losing everything? If you use the 200-day moving average rule, then you get out. You play defense, and you get out.” PTJ should know – not only did he avoid the “Black Monday” crash of 1987, but he made the bulk of his fortune being short the market.
Image Source: StockCharts.com
Bottom Line
The importance of simplicity in trading strategies and analysis should not be understated. A few straightforward indicators can provide investors consistency, discipline, clarity, ease of implementation, and robustness.