We use cookies to understand how you use our site and to improve your experience.
This includes personalizing content and advertising.
By pressing "Accept All" or closing out of this banner, you consent to the use of all cookies and similar technologies and the sharing of information they collect with third parties.
You can reject marketing cookies by pressing "Deny Optional," but we still use essential, performance, and functional cookies.
In addition, whether you "Accept All," Deny Optional," click the X or otherwise continue to use the site, you accept our Privacy Policy and Terms of Service, revised from time to time.
You are being directed to ZacksTrade, a division of LBMZ Securities and licensed broker-dealer. ZacksTrade and Zacks.com are separate companies. The web link between the two companies is not a solicitation or offer to invest in a particular security or type of security. ZacksTrade does not endorse or adopt any particular investment strategy, any analyst opinion/rating/report or any approach to evaluating individual securities.
If you wish to go to ZacksTrade, click OK. If you do not, click Cancel.
How COVID Reshaped Retail Spending, Retailers & Goods Production
Read MoreHide Full Article
This is an excerpt from our most recent Economic Outlook report. To access the full PDF, please click here
To begin, there are ~4M retail establishments in the USA. Retail establishments come in a variety of forms, such as grocery stores, big box stores, restaurants and boutiques.
Statista projects total retail sales in the United States should amount to $5.35T U.S. dollars in 2025, up from around $4.85T in 2019. For comparison, the U.S. economy will be ~$26.7T in 2025. Meaning the U.S. retail sector adds up to ~20% of the economy.
To understand U.S. retail, this update relies on Census data 1st, and FRED data 2nd.
The U.S. Census Bureau’s Advance Monthly and Monthly Retail Trade Surveys (MARTS and MRTS); the Annual Retail Trade Survey (ARTS); and the quarterly E-Commerce report work together to produce the most comprehensive data available on retail activity in the United States. Consult five broad Census retail sales metrics below:
Image Source: U.S. Census
In sum, retail sales fell swiftly in March 2020, as a result of the coronavirus pandemic shutdowns. And again, during the winter 20-21 pre-vaccinated spike in COVID cases.
But by late 2021, as the U.S. Census summary monthly retail sales chart (above) shows you, the U.S. is now seeing record levels of monthly retail sales activity.
Which industries did COVID-19 affect the most?
The COVID-19 crisis caused consumers to shift their spending focus towards necessities. In other words, people in the United States spent more on groceries and household supplies.
Most other industries, including out-of-home entertainment, restaurants, apparel and footwear stores, saw a substantial decrease in consumer spending -- as a result of the virus outbreak.
Hoarding behavior among consumers
Not only did consumers change what they bought, there were also times when shoppers would purchase larger quantities.
During the first weeks of the pandemic, hoarding was very prominent among households in the United States. Over the later quarters, pantry filling and hoarding behavior fluctuated, but showed a mostly downward trend.
In the following U.S. Census charts, I noted the following related retailer trends:
First off, grocery stores sales spiked at the onset of the pandemic, ($55B to $75 a month). Grocery store sales have also stayed higher than in pre-pandemic times, as of late 2021 ($70B a month).
Cooking and eating-at-home are bigger habits now. Remote working, and fears about contacting the virus from the unvaccinated are two enduring COVID demand drivers.
Image Source: U.S. Census
As for general merchandise stores?
Sales saw a lower post-vaccination rise, but a rise nonetheless. Note the seasonal sales spikes around the U.S. Christmas holidays. A Xmas sales surge should materialize this year (2021) too.
Image Source: U.S. Census
Annual seasonality in General Merchandise sales data (above) suggests any break from consumer price pressures cannot be expected until well after Christmas of 2022.
Consumer behavior near the end of a pandemic
According to Statista, the COVID pandemic caused many consumers to exhibit different behavior patterns when shopping.
For example, about 40% of consumers in the United States gave a new shopping method or a different brand a try.
Nonstore Retailers were the major benefactors of this push to find new shopping methods. Consult that in the chart below.
Image Source: U.S. Census
In 2021, according to Statista, about a third of marketing executives at consumer product manufacturers in the United States felt more dependent on Amazon (AMZN - Free Report) as a result of the coronavirus pandemic.
Only about one in ten surveyed execs stated they had become less dependent on the e-commerce platform since the outbreak. Approximately half did not experience any notable changes.
According to a Statista poll run in March 2021, home delivery services were used by 60% of online grocery shoppers in the United States. Another 32% of surveyed U.S. consumers usually purchasing their groceries online opted for curbside pickup.
In the second half of 2021, as the United States gets closer to reaching herd immunity each day, many of the country’s consumers have also increased their leisure expenditures.
Nearly six in ten half and fully vaccinated consumers planned to spend more money than usual on certain products and services as a way to indulge themselves. Even those who are not yet or not likely to get vaccinated planned to treat themselves in this manner.
Many American consumers specifically intended to spend a little extra on restaurants, & bars, travel, clothing, and several other items.
A Food & Drink sales chart (below) shows the evidence of this surge.
Image Source: U.S. Census
What about shopping in-store at Electronics Stores? No lift. Perhaps the opposite. Image Source: U.S. Census
That brings us to the story of the Motor Vehicle and Parts Dealers.
The parts retailers have done phenomenally well. Many top Zacks Ranked stocks over the last 18 months are Auto Parts Dealers. Think AutoNation (AN - Free Report) , AutoZone (AZO - Free Report) , Advance Auto Parts (AAP - Free Report) and O’Reilly Automotive (ORLY - Free Report) .
Demand and Prices have been strong.
Aa evidence of that, General Motors’ (GM - Free Report) average transaction price per new vehicle set a full-year record of $39,229 in 2020. The average down payment for a new vehicle also climbed to $4,734 in Q4 2020, from $4,329 a year earlier, Edmunds said.
Low auto loan rates, strong consumer savings, an aversion to subway travel, and/or any other means of avoiding contact with the unvaccinated. All of these are providing a lift to auto sales.
Then, there is the semiconductor chip shortage, which modern autos rely on. This is forcing up demand for late model used vehicles, to reach record levels.
Image Source: U.S. Census
Image Source: U.S. Census
See More Zacks Research for These Tickers
Normally $25 each - click below to receive one report FREE:


Image: Shutterstock
How COVID Reshaped Retail Spending, Retailers & Goods Production
This is an excerpt from our most recent Economic Outlook report. To access the full PDF, please click here
To begin, there are ~4M retail establishments in the USA. Retail establishments come in a variety of forms, such as grocery stores, big box stores, restaurants and boutiques.
Statista projects total retail sales in the United States should amount to $5.35T U.S. dollars in 2025, up from around $4.85T in 2019. For comparison, the U.S. economy will be ~$26.7T in 2025. Meaning the U.S. retail sector adds up to ~20% of the economy.
To understand U.S. retail, this update relies on Census data 1st, and FRED data 2nd.
The U.S. Census Bureau’s Advance Monthly and Monthly Retail Trade Surveys (MARTS and MRTS); the Annual Retail Trade Survey (ARTS); and the quarterly E-Commerce report work together to produce the most comprehensive data available on retail activity in the United States. Consult five broad Census retail sales metrics below:
In sum, retail sales fell swiftly in March 2020, as a result of the coronavirus pandemic shutdowns. And again, during the winter 20-21 pre-vaccinated spike in COVID cases.
But by late 2021, as the U.S. Census summary monthly retail sales chart (above) shows you, the U.S. is now seeing record levels of monthly retail sales activity.
Which industries did COVID-19 affect the most?
The COVID-19 crisis caused consumers to shift their spending focus towards necessities. In other words, people in the United States spent more on groceries and household supplies.
Most other industries, including out-of-home entertainment, restaurants, apparel and footwear stores, saw a substantial decrease in consumer spending -- as a result of the virus outbreak.
Hoarding behavior among consumers
Not only did consumers change what they bought, there were also times when shoppers would purchase larger quantities.
During the first weeks of the pandemic, hoarding was very prominent among households in the United States. Over the later quarters, pantry filling and hoarding behavior fluctuated, but showed a mostly downward trend.
In the following U.S. Census charts, I noted the following related retailer trends:
First off, grocery stores sales spiked at the onset of the pandemic, ($55B to $75 a month). Grocery store sales have also stayed higher than in pre-pandemic times, as of late 2021 ($70B a month).
Cooking and eating-at-home are bigger habits now. Remote working, and fears about contacting the virus from the unvaccinated are two enduring COVID demand drivers.
As for general merchandise stores?
Sales saw a lower post-vaccination rise, but a rise nonetheless. Note the seasonal sales spikes around the U.S. Christmas holidays. A Xmas sales surge should materialize this year (2021) too.
Annual seasonality in General Merchandise sales data (above) suggests any break from consumer price pressures cannot be expected until well after Christmas of 2022.
Consumer behavior near the end of a pandemic
According to Statista, the COVID pandemic caused many consumers to exhibit different behavior patterns when shopping.
For example, about 40% of consumers in the United States gave a new shopping method or a different brand a try.
Nonstore Retailers were the major benefactors of this push to find new shopping methods. Consult that in the chart below.
In 2021, according to Statista, about a third of marketing executives at consumer product manufacturers in the United States felt more dependent on Amazon (AMZN - Free Report) as a result of the coronavirus pandemic.
Only about one in ten surveyed execs stated they had become less dependent on the e-commerce platform since the outbreak. Approximately half did not experience any notable changes.
According to a Statista poll run in March 2021, home delivery services were used by 60% of online grocery shoppers in the United States. Another 32% of surveyed U.S. consumers usually purchasing their groceries online opted for curbside pickup.
In the second half of 2021, as the United States gets closer to reaching herd immunity each day, many of the country’s consumers have also increased their leisure expenditures.
Nearly six in ten half and fully vaccinated consumers planned to spend more money than usual on certain products and services as a way to indulge themselves.
Even those who are not yet or not likely to get vaccinated planned to treat themselves in this manner.
Many American consumers specifically intended to spend a little extra on restaurants, & bars, travel, clothing, and several other items.
A Food & Drink sales chart (below) shows the evidence of this surge.
What about shopping in-store at Electronics Stores? No lift. Perhaps the opposite.
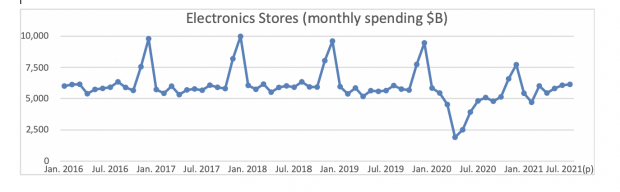 Image Source: U.S. Census
That brings us to the story of the Motor Vehicle and Parts Dealers.
The parts retailers have done phenomenally well. Many top Zacks Ranked stocks over the last 18 months are Auto Parts Dealers. Think AutoNation (AN - Free Report) , AutoZone (AZO - Free Report) , Advance Auto Parts (AAP - Free Report) and O’Reilly Automotive (ORLY - Free Report) .
Demand and Prices have been strong.
Aa evidence of that, General Motors’ (GM - Free Report) average transaction price per new vehicle set a full-year record of $39,229 in 2020. The average down payment for a new vehicle also climbed to $4,734 in Q4 2020, from $4,329 a year earlier, Edmunds said.
Low auto loan rates, strong consumer savings, an aversion to subway travel, and/or any other means of avoiding contact with the unvaccinated. All of these are providing a lift to auto sales.
Then, there is the semiconductor chip shortage, which modern autos rely on. This is forcing up demand for late model used vehicles, to reach record levels.