The January Barometer is a market theory that was first devised in 1972 by Yale Hirsch (founder of the Stock Trader’s Almanac Series) and states that as the S&P 500 goes in January, so goes the year. Supporters of this view believe that if the S&P 500 rises in the month of January, the index will show positive returns for the year. Similarly, if the market fares poorly in January, it will likely produce subpar returns during the course of the year.
This is not to be confused with the January Effect, which is a perceived seasonal tendency for stocks to rise during the month. This hypothesis is theorized to occur as investors sell before the prior year-end to engage in tax-loss harvesting in order to offset capital gains taxes, and then use those funds to speculate in January which contributes to the monthly rally.
The barometer’s record has been quite accurate. According to the Stock Trader’s Almanac, when the S&P had positive returns in the month of January, the average return for the year was 17.6% since 1950. The barometer has registered just eleven yearly errors over that timeframe, resulting in 84.5% accuracy.
Down Januarys can signal trouble ahead. With the exception of last year, since 1950 every down January was succeeded by either a new or continuing bear market, a 10%+ correction (after January), or a relatively flat year.
Januarys that posted negative returns were followed by substantial declines averaging -12.9%. For the record I don’t anticipate a multi-year, full-fledged bear market; rather, it is my view that 2022 will be a ‘pause’ year in what is ultimately a new bull market that began after the pandemic-induced plunge in March 2020. The market is forward-looking and its main drivers are earnings and economic activity. Earnings growth as well as GDP growth are set to slow but still remain positive.
While these historical statistics may paint a gloomy picture for 2022 market returns, it’s important to remember that this doesn’t necessarily mean this year will follow the path that the barometer predicts. For example, last year the S&P 500 was down slightly over 1% in January but finished the year with about a 27% return. The historical stats simply speak to probabilities and need to be taken with a grain of salt.
Another related system that Mr. Hirsch is credited with is known as the ‘Early Warning System’, which dictates that the first five trading days of January can foretell the S&P 500’s return for the rest of the year. The last 46 times that the first five days have been positive, the S&P 500 produced positive gains in 38 of those times resulting in 82.6% accuracy. Since 1950, there have been 25 years in which the first five trading days were down, which were followed by 14 up years and 11 down (44% accuracy) and an average gain of just 1%.
What happens when the S&P 500 is down in the first five trading days and the entire month of January?
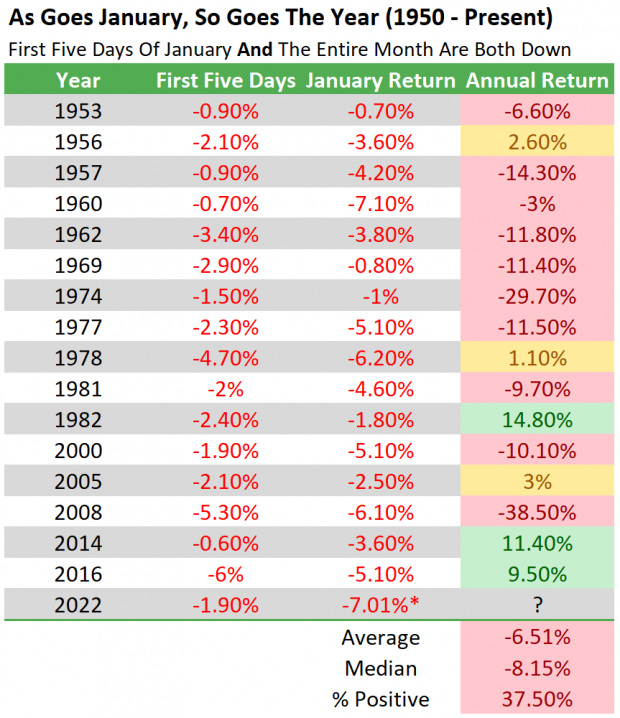 Image Source: Zacks Investment Research. January 2022 return as of 1/28.
In the 16 years since 1950 where both events occurred, stocks produced an average return of -6.51% and were positive just 37.5% of the time. Note that in 3 of the 16 years, including the most recent two instances in 2014 and 2016, stocks produced a positive return. No mechanical or rule-based system is perfect all of the time, but these systems are certainly useful in gauging probabilities.
The good news is when the barometer does hold true and the market produces underwhelming returns, it has almost always provided good buying opportunities for later years. And with 2023 being the historically bullish third year of the presidential cycle, there are reasons to be optimistic about a more severe pullback in the months that follow serving as solid buy point this year.
Make sure you’re ready to take full advantage when the time comes.


Image: Bigstock
As Goes January...So Goes The Year?
The January Barometer is a market theory that was first devised in 1972 by Yale Hirsch (founder of the Stock Trader’s Almanac Series) and states that as the S&P 500 goes in January, so goes the year. Supporters of this view believe that if the S&P 500 rises in the month of January, the index will show positive returns for the year. Similarly, if the market fares poorly in January, it will likely produce subpar returns during the course of the year.
This is not to be confused with the January Effect, which is a perceived seasonal tendency for stocks to rise during the month. This hypothesis is theorized to occur as investors sell before the prior year-end to engage in tax-loss harvesting in order to offset capital gains taxes, and then use those funds to speculate in January which contributes to the monthly rally.
The barometer’s record has been quite accurate. According to the Stock Trader’s Almanac, when the S&P had positive returns in the month of January, the average return for the year was 17.6% since 1950. The barometer has registered just eleven yearly errors over that timeframe, resulting in 84.5% accuracy.
Down Januarys can signal trouble ahead. With the exception of last year, since 1950 every down January was succeeded by either a new or continuing bear market, a 10%+ correction (after January), or a relatively flat year.
Januarys that posted negative returns were followed by substantial declines averaging -12.9%. For the record I don’t anticipate a multi-year, full-fledged bear market; rather, it is my view that 2022 will be a ‘pause’ year in what is ultimately a new bull market that began after the pandemic-induced plunge in March 2020. The market is forward-looking and its main drivers are earnings and economic activity. Earnings growth as well as GDP growth are set to slow but still remain positive.
While these historical statistics may paint a gloomy picture for 2022 market returns, it’s important to remember that this doesn’t necessarily mean this year will follow the path that the barometer predicts. For example, last year the S&P 500 was down slightly over 1% in January but finished the year with about a 27% return. The historical stats simply speak to probabilities and need to be taken with a grain of salt.
Another related system that Mr. Hirsch is credited with is known as the ‘Early Warning System’, which dictates that the first five trading days of January can foretell the S&P 500’s return for the rest of the year. The last 46 times that the first five days have been positive, the S&P 500 produced positive gains in 38 of those times resulting in 82.6% accuracy. Since 1950, there have been 25 years in which the first five trading days were down, which were followed by 14 up years and 11 down (44% accuracy) and an average gain of just 1%.
What happens when the S&P 500 is down in the first five trading days and the entire month of January?
In the 16 years since 1950 where both events occurred, stocks produced an average return of -6.51% and were positive just 37.5% of the time. Note that in 3 of the 16 years, including the most recent two instances in 2014 and 2016, stocks produced a positive return. No mechanical or rule-based system is perfect all of the time, but these systems are certainly useful in gauging probabilities.
The good news is when the barometer does hold true and the market produces underwhelming returns, it has almost always provided good buying opportunities for later years. And with 2023 being the historically bullish third year of the presidential cycle, there are reasons to be optimistic about a more severe pullback in the months that follow serving as solid buy point this year.
Make sure you’re ready to take full advantage when the time comes.