This is an excerpt from our most recent Economic Outlook report. To access the full PDF, please click here.
Yes folks, I know. At the current moment, this is the multi-trillion-dollar macro question.
I will do my best to frame a coherent set of answers for all of you.
Can the FOMC engineer a “soft” landing? It depends on how the U.S. housing situation plays out.
I. Coming up with the proper U.S. monthly “Median” household income measure
The U.S. Census Bureau reports average and median U.S. incomes in September of each year.
As the following U.S. Census table shows, there are plenty of ways to group households, families (households with children), Married-couple families, and Nonfamily households.
"Mean income" is a simple average calculation. This is a term used by many to describe median income, or how much money the people at the middle of the income scale make per year.
“Median income” is a more accurate picture of middle-earner's income than average income, because the number of high earners skews the average income amount.
View all of nuances in the 2020 U.S. Census table below.
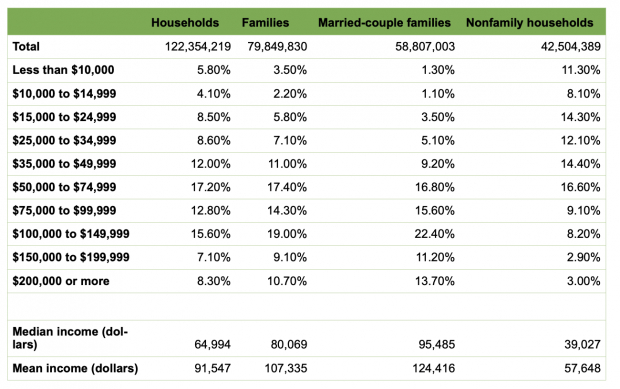
Image Source: U.S. Census 2020
The weekly median household income in the U.S. in 2021 was $67,521 annually.
But that is not the right measure to put up against single-family U.S. home price increases…
For the purposes of trying to determine the effects of a swift rise in single-family home prices?
I benchmark with Families ($80,069 median income) and not Married-couple Families ($95,485).
- Per month, the Household number amounts to $5,626.75.
- I get a higher $6,672 available per month for Families.
- I get a much higher $7,957 per month for Married-couple Families.
II. Coming up with the proper “Median” sales price of existing single-family homes
Let’s stick with median measures, for apples-to-apples.
According to the National Association of Realtors (NAR), the median sales price of existing single-family homes was $374,500 in FEB 2022.
In FEB 2021, it was $345,300. An +8.5% annual gain.
The median sales price is now $400,600, according to the U.S. Census (and not the “average” I applied gratis the National Association of Realtors), by the way.
The U.S. Census said the ‘average’ new home sales price is a whopping $511,000 in FEB 2022.
Again, “existing” and “new” are different sales categories. I will apply the lower one as a benchmark. But that is just a choice I made. You could use the other data.
What’s the average downpayment on a house?
If you said 20%, you’re in good company — it’s a popular perception.
But that’s far from true.
In 2021, the National Association of Realtors found the average down payment on a house or condo was just 12%. For home buyers aged 30 and under, that number drops to 6%.
And many people put down even less money — or no money at all.
Let’s use 12% for our benchmark calculations.
III. Now we set the context, to incorporate what is happening to 30-yr fixed mortgage rates.
Benchmark U.S. mortgage rates have seen a swift rise.
- On April 7th, 2022, the USA 30-yr fixed rate mortgage average clocked in at 4.72%.
- Entering 2022? This 30-yr mortgage rate was 3.11%.
- 1.61% in just over 3 months. Roughly 50 basis points a month.
The average monthly mortgage payment on a $374,300 median sales price of an existing single-family U.S. home, using an average 12% down payment, means coming up with $44,915 as an up-front down payment now.
The median U.S. family has to get a mortgage for the other $329,384.
At 4.72%? That is $1,712 a month. At 3.0%? That means coming up with $1,389 a month.
Include taxes and fees? At 4.72%? That comes to $2.261. At 3.0%? That means coming up with $1,938 a month. This amounts to coming up with another $323 a month.
At $6,672 a month available to Median U.S. Families, that $323 a month increase amounts to a monthly mortgage payment rise of +4.8%.
Confirm this in a FRED chart shown next.
30-Year Fixed Rate Mortgage Average in the USA
(April 2012 to April 2022)
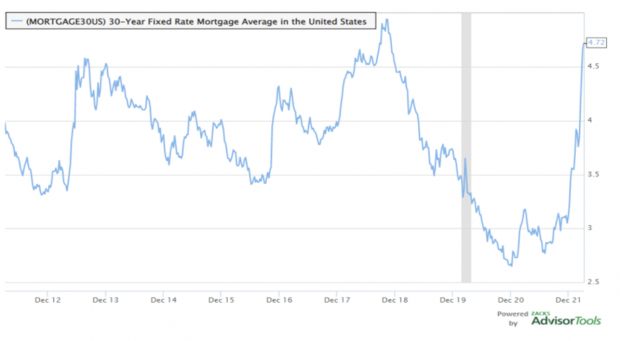
Image Source: Zacks Investment Research
Note that the U.S. has seen this level of 30-year fixed mortgage rates, as recently as 2019. Prior to that, in 2014.
So, it has been a swift and stunning rise. But the 30-year fixed mortgage rate is not yet out of a comfortable recent range.
If the median U.S. sales price of a single-family home rose +8.5% annually to FEB 2022.
That +4.8% sudden rise in monthly mortgage costs should leave only +3.7% remaining, in terms of appreciation.
Surely, the home price ascent will slow down. This review provides context to how much.
Now, let’s conclude this review, but looking into the macro housing context.
IV. Let’s apply Zacks Housing Dashboard, gratis Zacks Research System (ZRS)
The Zacks Housing Dashboard contains 4 time series panels, of annual data:
- New Single Family Home Sales
- Median Sales Price of Houses Sold (1-Yr % Change)
- Houses for Sale – Month’ Supply at Current Sales Rate (NSA)
- New Privately Owned Housing Units Started (SAAR)
Consult the historic timeline, going all the way back to 1960, and running up to the present.
The Housing “Dashboard”: Four Zacks Housing Indicators (1960 to 2022)
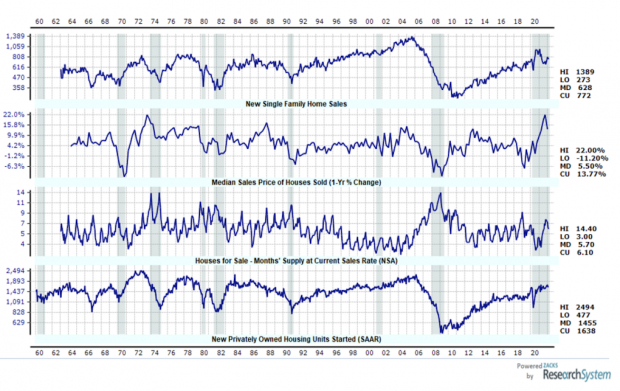
Image Source: Zacks Investment Research
Let’s review this:
Number One – New Single Family Home Sales
The current number is +772K per month for FEB 2022. This is tied to that $511,000 average sales price of a newly-constructed home.
The Median, running from 1960 to 2022 is +628K a month. The U.S. is running +23% above the median new home sales data.
But the standard range of this data goes from 900K a month down to 450K. 772K is floating around the middle of that historic range.
So, I conclude new single-family home construction in 2022 is just above average.
Lots of people worry about the 2006 type of single-family homebuilder era euphoria. At that time, the high number was 1,389K per month. That is nearly double the current amount.
The U.S. single-family new home construction rate plunged to 273K in 2011.
From the chart, it looks to be like mean reversion in new single-family home construction has taken place.
I conclude with this: The 722K a month backdrop of new single-family home construction is not likely to be a significant added factor to the overall U.S. home demand-supply narrative, balancing any market. Not at this time, anyway.
Number Two – Median Sales Price of Houses Sold (1-Yr % Change)
This is scarier data for home-owners, wealth calculations and stock investors, more generally.
The U.S. housing market has just come off the boil, recording a +22.0% annual appreciation here. We are now seeing “just” +13.77% as a current median sales price appreciation.
The historic median? +5.7%. Not good!
In the second Zacks Housing Dashboard chart, I count six (clean) trips when annual single-family home price appreciation got over +12.8% annually.
I count 4 recessions that followed. But the lags can often be significant (1 year, 1 year, 2.5 years, 3.5 years).
Number Three – Houses for Sale: Month’s Supply at Current Sales Rate (NSA)
The U.S. market currently has 6.1 month’s supply of single-family homes for sale.
The median is 5.7. That’s good.
The high of 14.4 month’s was recorded in 2009. That peak inventory point was marked near the end of the last big housing-induced recession.
We don’t have a huge U.S. houses-for-sale inventory overhang to deal with at the current moment.
Number Four -- New Privately Owned Housing Units Started (SAAR)
The current housing starts rate is 1.638M per month in FEB 2022.
The median is 1.455M per month. According to this measure, we are +12.5% above the monthly home starts median now.
The high was seen in 2005 at 2.494M. The U.S. is 856K homes away from that now. In other words, the homebuilders are not even close to producing an oversupply of new units, like they did in the last housing debacle.
Memories are often most linked to the most recent experiences. This is why the cognitive problem is called “recency bias.”
Did the “smart money” get the housing cycle right, including much more of the past?
In the prior 4 peaks in New Privately Owned Housing Units Started, I see 4 recessions followed (1 year later, 1 year later, 6 years later, and 2 years later).
In sum, if the new U.S. monthly housing starts number rolls over, definitively, we have another very rough housing cycle indicator. With an emphasis on “rough.”


Image: Bigstock
How Does U.S. Housing Slow Down?
This is an excerpt from our most recent Economic Outlook report. To access the full PDF, please click here.
Yes folks, I know. At the current moment, this is the multi-trillion-dollar macro question.
I will do my best to frame a coherent set of answers for all of you.
Can the FOMC engineer a “soft” landing? It depends on how the U.S. housing situation plays out.
I. Coming up with the proper U.S. monthly “Median” household income measure
The U.S. Census Bureau reports average and median U.S. incomes in September of each year.
As the following U.S. Census table shows, there are plenty of ways to group households, families (households with children), Married-couple families, and Nonfamily households.
"Mean income" is a simple average calculation. This is a term used by many to describe median income, or how much money the people at the middle of the income scale make per year.
“Median income” is a more accurate picture of middle-earner's income than average income, because the number of high earners skews the average income amount.
View all of nuances in the 2020 U.S. Census table below.
Image Source: U.S. Census 2020
The weekly median household income in the U.S. in 2021 was $67,521 annually.
But that is not the right measure to put up against single-family U.S. home price increases…
For the purposes of trying to determine the effects of a swift rise in single-family home prices?
I benchmark with Families ($80,069 median income) and not Married-couple Families ($95,485).
II. Coming up with the proper “Median” sales price of existing single-family homes
Let’s stick with median measures, for apples-to-apples.
According to the National Association of Realtors (NAR), the median sales price of existing single-family homes was $374,500 in FEB 2022.
In FEB 2021, it was $345,300. An +8.5% annual gain.
The median sales price is now $400,600, according to the U.S. Census (and not the “average” I applied gratis the National Association of Realtors), by the way.
The U.S. Census said the ‘average’ new home sales price is a whopping $511,000 in FEB 2022.
Again, “existing” and “new” are different sales categories. I will apply the lower one as a benchmark. But that is just a choice I made. You could use the other data.
What’s the average downpayment on a house?
If you said 20%, you’re in good company — it’s a popular perception.
But that’s far from true.
In 2021, the National Association of Realtors found the average down payment on a house or condo was just 12%. For home buyers aged 30 and under, that number drops to 6%.
And many people put down even less money — or no money at all.
Let’s use 12% for our benchmark calculations.
III. Now we set the context, to incorporate what is happening to 30-yr fixed mortgage rates.
Benchmark U.S. mortgage rates have seen a swift rise.
The average monthly mortgage payment on a $374,300 median sales price of an existing single-family U.S. home, using an average 12% down payment, means coming up with $44,915 as an up-front down payment now.
The median U.S. family has to get a mortgage for the other $329,384.
At 4.72%? That is $1,712 a month. At 3.0%? That means coming up with $1,389 a month.
Include taxes and fees? At 4.72%? That comes to $2.261. At 3.0%? That means coming up with $1,938 a month. This amounts to coming up with another $323 a month.
At $6,672 a month available to Median U.S. Families, that $323 a month increase amounts to a monthly mortgage payment rise of +4.8%.
Confirm this in a FRED chart shown next.
30-Year Fixed Rate Mortgage Average in the USA
(April 2012 to April 2022)
Image Source: Zacks Investment Research
Note that the U.S. has seen this level of 30-year fixed mortgage rates, as recently as 2019. Prior to that, in 2014.
So, it has been a swift and stunning rise. But the 30-year fixed mortgage rate is not yet out of a comfortable recent range.
If the median U.S. sales price of a single-family home rose +8.5% annually to FEB 2022.
That +4.8% sudden rise in monthly mortgage costs should leave only +3.7% remaining, in terms of appreciation.
Surely, the home price ascent will slow down. This review provides context to how much.
Now, let’s conclude this review, but looking into the macro housing context.
IV. Let’s apply Zacks Housing Dashboard, gratis Zacks Research System (ZRS)
The Zacks Housing Dashboard contains 4 time series panels, of annual data:
Consult the historic timeline, going all the way back to 1960, and running up to the present.
The Housing “Dashboard”: Four Zacks Housing Indicators (1960 to 2022)
Image Source: Zacks Investment Research
Let’s review this:
Number One – New Single Family Home Sales
The current number is +772K per month for FEB 2022. This is tied to that $511,000 average sales price of a newly-constructed home.
The Median, running from 1960 to 2022 is +628K a month. The U.S. is running +23% above the median new home sales data.
But the standard range of this data goes from 900K a month down to 450K. 772K is floating around the middle of that historic range.
So, I conclude new single-family home construction in 2022 is just above average.
Lots of people worry about the 2006 type of single-family homebuilder era euphoria. At that time, the high number was 1,389K per month. That is nearly double the current amount.
The U.S. single-family new home construction rate plunged to 273K in 2011.
From the chart, it looks to be like mean reversion in new single-family home construction has taken place.
I conclude with this: The 722K a month backdrop of new single-family home construction is not likely to be a significant added factor to the overall U.S. home demand-supply narrative, balancing any market. Not at this time, anyway.
Number Two – Median Sales Price of Houses Sold (1-Yr % Change)
This is scarier data for home-owners, wealth calculations and stock investors, more generally.
The U.S. housing market has just come off the boil, recording a +22.0% annual appreciation here. We are now seeing “just” +13.77% as a current median sales price appreciation.
The historic median? +5.7%. Not good!
In the second Zacks Housing Dashboard chart, I count six (clean) trips when annual single-family home price appreciation got over +12.8% annually.
I count 4 recessions that followed. But the lags can often be significant (1 year, 1 year, 2.5 years, 3.5 years).
Number Three – Houses for Sale: Month’s Supply at Current Sales Rate (NSA)
The U.S. market currently has 6.1 month’s supply of single-family homes for sale.
The median is 5.7. That’s good.
The high of 14.4 month’s was recorded in 2009. That peak inventory point was marked near the end of the last big housing-induced recession.
We don’t have a huge U.S. houses-for-sale inventory overhang to deal with at the current moment.
Number Four -- New Privately Owned Housing Units Started (SAAR)
The current housing starts rate is 1.638M per month in FEB 2022.
The median is 1.455M per month. According to this measure, we are +12.5% above the monthly home starts median now.
The high was seen in 2005 at 2.494M. The U.S. is 856K homes away from that now. In other words, the homebuilders are not even close to producing an oversupply of new units, like they did in the last housing debacle.
Memories are often most linked to the most recent experiences. This is why the cognitive problem is called “recency bias.”
Did the “smart money” get the housing cycle right, including much more of the past?
In the prior 4 peaks in New Privately Owned Housing Units Started, I see 4 recessions followed (1 year later, 1 year later, 6 years later, and 2 years later).
In sum, if the new U.S. monthly housing starts number rolls over, definitively, we have another very rough housing cycle indicator. With an emphasis on “rough.”