This is an excerpt from our most recent Economic Outlook report. To access the full PDF, please click here
I. Introduction
The latest batch of U.S. Consumer Price Inflation (CPI) data came out Wednesday, May 11th, 2022.
That fresh April Bureau of Labor Statistics (BLS) data showed the U.S. economy marking a +8.3% y/y All Items Consumer Price Inflation rate. Consensus was looking for +8.1%. That’s a miss.
In turn, the U.S. economy showed us a lower +6.2% y/y All items - less food and energy CPI rate.
There was a small amount of embedded good news for those looking to call a peak in this episode of high consumer price inflation:
- Energy commodities clambered down -5.4% over the month of April
- All types of Gasoline went down -6.1%
- Used Cars and Trucks prices have headed down for 3 months in a row (-0.2, -3.8, -0.4), and
- Apparel prices showed initial weakness (-0.8% in April)
On the basis of the latest April 2022 U.S. CPI data, I would not opine a major serial peak in the All-Items Consumer Price Inflation rate is in hand. The CPI data remained near a four-decade high.
These are encouraging signs, in hand, now. But downwards CPI change is not broad-based. Yet.
The chain of Fed Open Market Committee (FOMC) logic is well-understood by financial markets.
Voting Fed members want the CPI to get back to a +2.0% average annual rate on the core metrics (not including food and energy). That is their binding statutory mandate, now that the other mandate, of full employment (the U.S. household rate is 3.6%) has been met.
So, the FOMC will be very likely keep unanimously voting to raise the Fed Funds rate towards its ‘neutral’ rate, perhaps even beyond that for a spell, to lower U.S. aggregate demand for ALL of these Items listed in this table. Not just Energy, Used Cars and Apparel.
Fed Funds rate hikes to 1.0%, and the prospect of many more hikes, already notably smashed the valuation of growth and momentum stocks, they steeply raised 30-yr fixed home mortgage rates, and more broadly, they lifted all consumer finance rates.
Let’s review the global story of Consumer Price Inflation — over the last two decades, particularly — to appreciate the longer and broader context of this latest major global high inflation episode.
II. Fear of Another 1973 Arab Oil Embargo
To help put the latest U.S. data into perspective, start by looking back at long-time series of Consumer Price Inflation data, and comparing U.S. data to peer data from 10 Top World Economies.
To begin, I put up a chart drawn from World Bank CPI Annual Percentage Change data going back to 1960 and running to COVID 2020. This is shown for a set of Top 10 major economies.
Zacks analysts broke this annual CPI data into two charts.
The USA, Canada (CAN), Germany (GER), France, (FRA) and Japan (JPN) annual % consumer price increases are plotted in the top panel (Chart 1).
The nations of India (IND), Great Britain (GBR), Italy (ITA), South Korea (KOR) and Mainland China (CHN) get plotted in the bottom panel (Chart 2).
From 1973 to 1982, you can see a distinct Chart 1 display of what is known as the Arab Oil Embargo effects on developed economies. Chart 2 shows how jumpy and high China, S. Korea, and India CPI rates were from 1973 to the middle 1990s. Their CPI series settled down afterwards.
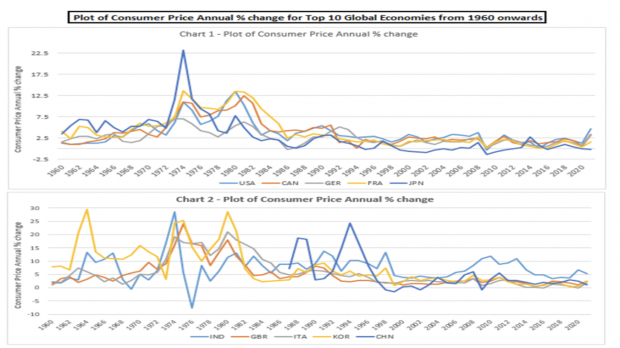
Image Source: Zacks Investment Research
At the start of the 1973 Arab Oil Embargo, the Japanese CPI blistered into a spike to +22.5% annual CPI. France made it to +12.5%. The USA and Canada came in around +10%. Germany was weakest at around 7.5%. The USA data did not get below a +2.5% annual CPI increase until 1982. The Fed statutory level of concern is around +2.0%.
In sum, that oil-market disruption created nearly a decade of serious, high CPI in these countries.
Today’s COVID-19 era health policy supply shutdowns mirror those oil embargo shutdowns.
Britannica offers a brief 1973 Arab Oil Embargo history:
“On October 6, 1973, Egypt and Syria launched a surprise attack against Israel on the Jewish holy day of Yom Kippur.
“Egyptian and Syrian forces made early gains across the Suez Canal and Golan Heights, but Israel quickly turned the tide, and within a few weeks Israeli troops had pushed forward into Egyptian and Syrian territory.
“In an attempt to pressure Western countries to force Israel to withdraw from seized lands, Arab members of OPEC (Organization of the Petroleum Exporting Countries) announced sharp production cuts and then banned the sale of oil to the United States and the Netherlands.
“Until that time, OPEC, which was formed in 1960, had kept a relatively low profile, mainly negotiating with international oil companies for better terms for member countries.
“Enmity toward the United States among OPEC members had risen in the years preceding the embargo as a result of actions taken by U.S. President Richard M. Nixon to boost the sluggish American economy.
“For example, Nixon ordered the release of the dollar from the gold standard, which had been in place since the end of World War II. The resulting devaluation of the currency led to financial losses on the part of oil-producing countries, whose revenues consisted largely of U.S. dollars.
“Enormous increases in Western oil consumption—more than doubling over approximately the preceding 25 years—also contributed to the severity of the crisis, as people in the developed world had become accustomed to cheap gasoline and relatively stable prices.
“After the imposition of the embargo, the price of a barrel of oil quadrupled by 1974. As a result, the United States experienced its first fuel shortage and first significant increase in gasoline prices since World War II.
“In response to the embargo, the U.S. government-imposed fuel rationing and lowered speed limits to reduce consumption.
“Nixon seriously considered military action to seize oil fields in Saudi Arabia, Kuwait and Abu Dhabi as a last resort. However, negotiations in Washington, D.C., led to the lifting of the embargo in March 1974.The embargo on the other countries remained in place for some time afterward.”
1983 would mark the end of a frustrating era that combined high inflation with substantial unemployment and sluggish growth.
This was labeled the era of “Stagflation,” meaning the US economy experienced both stagnation in GDP growth and high consumer price inflation at the same time.


Image: Bigstock
Has the World Economy Seen Peak Consumer Price Inflation?
This is an excerpt from our most recent Economic Outlook report. To access the full PDF, please click here
I. Introduction
The latest batch of U.S. Consumer Price Inflation (CPI) data came out Wednesday, May 11th, 2022.
That fresh April Bureau of Labor Statistics (BLS) data showed the U.S. economy marking a +8.3% y/y All Items Consumer Price Inflation rate. Consensus was looking for +8.1%. That’s a miss.
In turn, the U.S. economy showed us a lower +6.2% y/y All items - less food and energy CPI rate.
There was a small amount of embedded good news for those looking to call a peak in this episode of high consumer price inflation:
On the basis of the latest April 2022 U.S. CPI data, I would not opine a major serial peak in the All-Items Consumer Price Inflation rate is in hand. The CPI data remained near a four-decade high.
These are encouraging signs, in hand, now. But downwards CPI change is not broad-based. Yet.
The chain of Fed Open Market Committee (FOMC) logic is well-understood by financial markets.
Voting Fed members want the CPI to get back to a +2.0% average annual rate on the core metrics (not including food and energy). That is their binding statutory mandate, now that the other mandate, of full employment (the U.S. household rate is 3.6%) has been met.
So, the FOMC will be very likely keep unanimously voting to raise the Fed Funds rate towards its ‘neutral’ rate, perhaps even beyond that for a spell, to lower U.S. aggregate demand for ALL of these Items listed in this table. Not just Energy, Used Cars and Apparel.
Fed Funds rate hikes to 1.0%, and the prospect of many more hikes, already notably smashed the valuation of growth and momentum stocks, they steeply raised 30-yr fixed home mortgage rates, and more broadly, they lifted all consumer finance rates.
Let’s review the global story of Consumer Price Inflation — over the last two decades, particularly — to appreciate the longer and broader context of this latest major global high inflation episode.
II. Fear of Another 1973 Arab Oil Embargo
To help put the latest U.S. data into perspective, start by looking back at long-time series of Consumer Price Inflation data, and comparing U.S. data to peer data from 10 Top World Economies.
To begin, I put up a chart drawn from World Bank CPI Annual Percentage Change data going back to 1960 and running to COVID 2020. This is shown for a set of Top 10 major economies.
Zacks analysts broke this annual CPI data into two charts.
The USA, Canada (CAN), Germany (GER), France, (FRA) and Japan (JPN) annual % consumer price increases are plotted in the top panel (Chart 1).
The nations of India (IND), Great Britain (GBR), Italy (ITA), South Korea (KOR) and Mainland China (CHN) get plotted in the bottom panel (Chart 2).
From 1973 to 1982, you can see a distinct Chart 1 display of what is known as the Arab Oil Embargo effects on developed economies. Chart 2 shows how jumpy and high China, S. Korea, and India CPI rates were from 1973 to the middle 1990s. Their CPI series settled down afterwards.
Image Source: Zacks Investment Research
At the start of the 1973 Arab Oil Embargo, the Japanese CPI blistered into a spike to +22.5% annual CPI. France made it to +12.5%. The USA and Canada came in around +10%. Germany was weakest at around 7.5%. The USA data did not get below a +2.5% annual CPI increase until 1982. The Fed statutory level of concern is around +2.0%.
In sum, that oil-market disruption created nearly a decade of serious, high CPI in these countries.
Today’s COVID-19 era health policy supply shutdowns mirror those oil embargo shutdowns.
Britannica offers a brief 1973 Arab Oil Embargo history:
“On October 6, 1973, Egypt and Syria launched a surprise attack against Israel on the Jewish holy day of Yom Kippur.
“Egyptian and Syrian forces made early gains across the Suez Canal and Golan Heights, but Israel quickly turned the tide, and within a few weeks Israeli troops had pushed forward into Egyptian and Syrian territory.
“In an attempt to pressure Western countries to force Israel to withdraw from seized lands, Arab members of OPEC (Organization of the Petroleum Exporting Countries) announced sharp production cuts and then banned the sale of oil to the United States and the Netherlands.
“Until that time, OPEC, which was formed in 1960, had kept a relatively low profile, mainly negotiating with international oil companies for better terms for member countries.
“Enmity toward the United States among OPEC members had risen in the years preceding the embargo as a result of actions taken by U.S. President Richard M. Nixon to boost the sluggish American economy.
“For example, Nixon ordered the release of the dollar from the gold standard, which had been in place since the end of World War II. The resulting devaluation of the currency led to financial losses on the part of oil-producing countries, whose revenues consisted largely of U.S. dollars.
“Enormous increases in Western oil consumption—more than doubling over approximately the preceding 25 years—also contributed to the severity of the crisis, as people in the developed world had become accustomed to cheap gasoline and relatively stable prices.
“After the imposition of the embargo, the price of a barrel of oil quadrupled by 1974. As a result, the United States experienced its first fuel shortage and first significant increase in gasoline prices since World War II.
“In response to the embargo, the U.S. government-imposed fuel rationing and lowered speed limits to reduce consumption.
“Nixon seriously considered military action to seize oil fields in Saudi Arabia, Kuwait and Abu Dhabi as a last resort. However, negotiations in Washington, D.C., led to the lifting of the embargo in March 1974.The embargo on the other countries remained in place for some time afterward.”
1983 would mark the end of a frustrating era that combined high inflation with substantial unemployment and sluggish growth.
This was labeled the era of “Stagflation,” meaning the US economy experienced both stagnation in GDP growth and high consumer price inflation at the same time.