This is an excerpt from our most recent Economic Outlook report. To access the full PDF, please click here.
With misperceptions and fears growing and growing — about a looming U.S. recession — it seems like a good time to consult the latest U.S. Federal Reserve Macro Snapshot.
The FRED Macro Snapshot is designed to provide insight into the macroeconomic data economists and policymakers at the Federal Reserve Bank of St. Louis use to analyze current economic conditions.
The Macro Snapshot shows important indicators delineated by topic. It is not exhaustive, featuring only some of the important aggregate series available on FRED.
Data on this dashboard updates within five to ten minutes of the data being uploaded into FRED©. The dashboard shown was last updated at 8:01 PM CT, 10/30/2023.
The overarching content of the dashboard—what series are included, how they are presented, etc.—is re-evaluated at least once a quarter to better reflect the St. Louis Fed's current analysis of the economy.
A. Gross Domestic Product (GDP)
1. Real potential GDP is the Congressional Budget Office’s (CBO) estimate of the output the U.S. economy would produce with a high rate of use of its capital and labor resources. The data is adjusted to remove the effects of inflation.
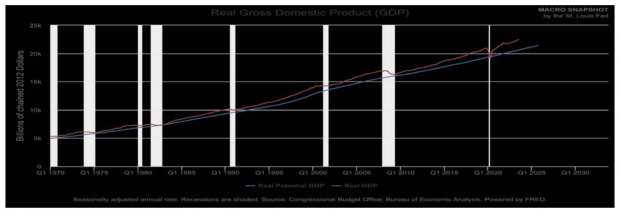
Image Source: St Louis Federal Reserve
The difference between the actual level of real GDP and potential GDP is known as the output gap. When the output gap is positive—when GDP is higher than potential—the U.S. economy operates above its sustainable capacity and is likely to generate inflation.
At the current moment in U.S. macroeconomic time (Nov. 2023) you can see this: A very wide positive real GDP-potential GDP difference. That means there is ongoing price pressure, producing a higher-than-normal inflation rate, a pressure felt unevenly, across the entire U.S. economy.
When GDP falls short of potential, the output gap is negative. The Macro Snapshot chart (above) shows recessions, such as the Great Recession of 07-09, and the COVID recession, and which feature GDP well below potential.
Concluding Note: There is no visible November 2023 sign of a negative output gap! Actually, we see the opposite trend: A widening positive real GDP to potential GDP gap.
2. Real gross domestic income (GDI) is a measure of the incomes earned and the costs incurred in the production of gross domestic product. It's another way of measuring U.S. economic activity.
The U.S. BEA also publishes the average of real GDP and real GDI (at +1.4% in Q2).
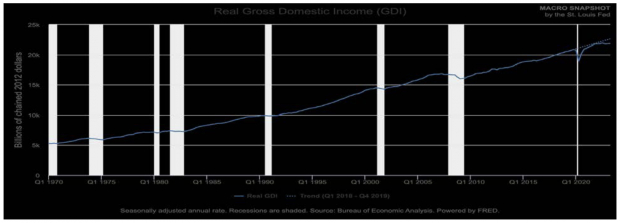
Image Source: St Louis Federal Reserve
Since exiting the COVID recession, real GDI has tracked below its 2018-2019 trend.
Why? Shutting down nearly all aggregate U.S. supply, for public health safety, then reopening that supply, upon vaccination, forced then-scarce goods prices to rise rapidly.
So, more than any other factor, a re-opening pulse of goods price pressure pushed real GDI below its recent trend.
Higher prices are what cut U.S. consumer sentiment down, broadly, too.
The Fed labelled this year-long re-opening good price pulse ‘transitory,’ for better or worse. More durable Services re-opening price pressure then followed along.
- Goods price pressure? That is what abated, with good production over time.
- Services price pressure? This set of prices have been ‘sticky.’
For example, Fed rate hiking has hit more discretionary auto finance terms first. Declining auto demand then lowered auto-related sales and production and auto-related prices, along that extended supply chain. Weakening auto market price effects have shown up in 2023, with the decline in used car prices leading the way.
Homes are widely financed, too. However, the sale of a more necessary home can be delayed for years, in anticipation of better buyer finance terms available later on.
Unless critical jobs and their incomes get lost, widely, across the economy! With a tight U.S. labor market in hand, a spiraling home market cascade, from job losses piling up, seems unlikely.
So, real GDP and price effects — via stiff 8.5% 30-year fixed home mortgages — should stagger out across a wider period of time.
B. GDP Components (C+I+G+NX)
At this point, get out your old college macro textbook.
Recall this equation: Aggregate Supply (Production) = Aggregate Demand (Income).
Aggregate Demand then gets carved up into four distinct component of U.S. demand:
- Personal Consumption (C), 69% in Q3-23
- Fixed Investments (I), 18%
- Government Consumption (G), 17%, and
- Net Exports (U.S. Exports minus U.S. Imports) -4%
C = Consumption refers to household expenditure on various goods and services.
Goods are of three types: non-durables (such as food and clothing), durables (such as autos and appliances) and services (such as hair styling, education, and medical care).
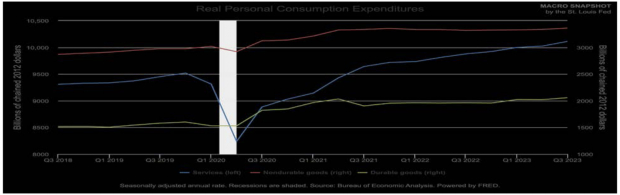
Image Source: St Louis Federal Reserve
Study the C chart from the Macro Snapshot above. Pick up these trends. Durable good spending has been slightly rising, in real terms. Non-durable goods spending looks flat.
What is showing up, as a rising trend? Services spending! Can FOMC rate hikes slow that Services spending in C down? That is what the financial markets have been attempting to price in.


Image: Bigstock
Time to Consult the 'Macro Snapshot'
This is an excerpt from our most recent Economic Outlook report. To access the full PDF, please click here.
With misperceptions and fears growing and growing — about a looming U.S. recession — it seems like a good time to consult the latest U.S. Federal Reserve Macro Snapshot.
The FRED Macro Snapshot is designed to provide insight into the macroeconomic data economists and policymakers at the Federal Reserve Bank of St. Louis use to analyze current economic conditions.
The Macro Snapshot shows important indicators delineated by topic. It is not exhaustive, featuring only some of the important aggregate series available on FRED.
Data on this dashboard updates within five to ten minutes of the data being uploaded into FRED©. The dashboard shown was last updated at 8:01 PM CT, 10/30/2023.
The overarching content of the dashboard—what series are included, how they are presented, etc.—is re-evaluated at least once a quarter to better reflect the St. Louis Fed's current analysis of the economy.
A. Gross Domestic Product (GDP)
1. Real potential GDP is the Congressional Budget Office’s (CBO) estimate of the output the U.S. economy would produce with a high rate of use of its capital and labor resources. The data is adjusted to remove the effects of inflation.
Image Source: St Louis Federal Reserve
The difference between the actual level of real GDP and potential GDP is known as the output gap. When the output gap is positive—when GDP is higher than potential—the U.S. economy operates above its sustainable capacity and is likely to generate inflation.
At the current moment in U.S. macroeconomic time (Nov. 2023) you can see this: A very wide positive real GDP-potential GDP difference. That means there is ongoing price pressure, producing a higher-than-normal inflation rate, a pressure felt unevenly, across the entire U.S. economy.
When GDP falls short of potential, the output gap is negative. The Macro Snapshot chart (above) shows recessions, such as the Great Recession of 07-09, and the COVID recession, and which feature GDP well below potential.
Concluding Note: There is no visible November 2023 sign of a negative output gap! Actually, we see the opposite trend: A widening positive real GDP to potential GDP gap.
2. Real gross domestic income (GDI) is a measure of the incomes earned and the costs incurred in the production of gross domestic product. It's another way of measuring U.S. economic activity.
The U.S. BEA also publishes the average of real GDP and real GDI (at +1.4% in Q2).
Image Source: St Louis Federal Reserve
Since exiting the COVID recession, real GDI has tracked below its 2018-2019 trend.
Why? Shutting down nearly all aggregate U.S. supply, for public health safety, then reopening that supply, upon vaccination, forced then-scarce goods prices to rise rapidly.
So, more than any other factor, a re-opening pulse of goods price pressure pushed real GDI below its recent trend.
Higher prices are what cut U.S. consumer sentiment down, broadly, too.
The Fed labelled this year-long re-opening good price pulse ‘transitory,’ for better or worse. More durable Services re-opening price pressure then followed along.
For example, Fed rate hiking has hit more discretionary auto finance terms first. Declining auto demand then lowered auto-related sales and production and auto-related prices, along that extended supply chain. Weakening auto market price effects have shown up in 2023, with the decline in used car prices leading the way.
Homes are widely financed, too. However, the sale of a more necessary home can be delayed for years, in anticipation of better buyer finance terms available later on.
Unless critical jobs and their incomes get lost, widely, across the economy! With a tight U.S. labor market in hand, a spiraling home market cascade, from job losses piling up, seems unlikely.
So, real GDP and price effects — via stiff 8.5% 30-year fixed home mortgages — should stagger out across a wider period of time.
B. GDP Components (C+I+G+NX)
At this point, get out your old college macro textbook.
Recall this equation: Aggregate Supply (Production) = Aggregate Demand (Income).
Aggregate Demand then gets carved up into four distinct component of U.S. demand:
C = Consumption refers to household expenditure on various goods and services.
Goods are of three types: non-durables (such as food and clothing), durables (such as autos and appliances) and services (such as hair styling, education, and medical care).
Image Source: St Louis Federal Reserve
Study the C chart from the Macro Snapshot above. Pick up these trends. Durable good spending has been slightly rising, in real terms. Non-durable goods spending looks flat.
What is showing up, as a rising trend? Services spending! Can FOMC rate hikes slow that Services spending in C down? That is what the financial markets have been attempting to price in.