This is an excerpt from our most recent Economic Outlook report. To access the full PDF, please click here.
I. Introduction
In this Zacks Econ piece, I want to discuss real estate markets, both commercial and residential.
The reason I want to do this? If a professional economist wants to look deeply for the source of a major U.S. recession, history shows that it can often be found in real estate price collapses.
Capture this sentiment, from chart 1 shown below. Value Added by this active, multi-faceted U.S. Real Estate industry rose to capture 13.8% of the U.S. economy’s total activity in 2025.
1. Value Added by Industry: Finance, Insurance, Real Estate, Rental, and Leasing: Real Estate and Rental and Leasing, as a Percentage of GDP (%, 2005-25)
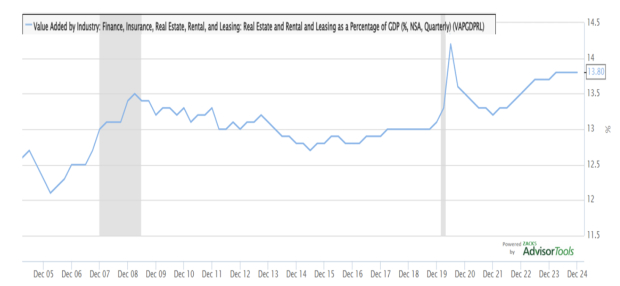
Image Source: Zacks Investment Research
If real estate prices collapse, a major banking loan crisis often results, initiating a financial market spiral, with wider consequences, seen across the entire U.S. macro-economic system.
Our first stop in this 2025 real estate analysis endeavor will be to check in on the status of both U.S. commercial and residential real estate prices.
You will learn this: there has been an incredible net worth that has been generated by the active Federal Reserve stimulation, of this part of the U.S. economic system.
II. The Status of U.S. Commercial and Residential Real Estate
In our opening St. Louis Fed FRED chart 2 (shown below) you can see Commercial Real Estate Prices for the USA, for the 20 years from 2005 to 2025. Grey areas represent U.S. recessions.
The 2008 real estate and financial crisis is notable, as is the short pandemic shutdown. In the former period, Commercial Real Estate Prices did indeed head south, as the economy entered recession. In COVID, there was a very brief dip into negative prices.
2. Commercial Real Estate Prices for the United States
(annual % change, 2005-2025)
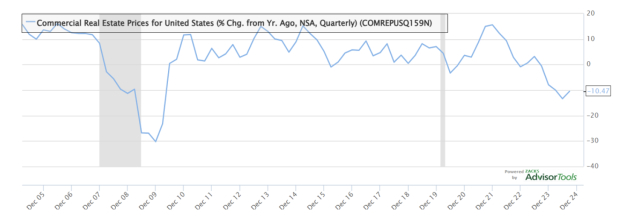
Image Source: Zacks Investment Research
Beginning in Q3-2023, we can note a -10.5% annual decline in commercial real estate prices.
The next chart 3 gives a different, more comforting perspective on this decline, as it shows Commercial Real Estate Index Prices, going back to 1945.
3. U.S. Commercial Real Estate Price Index, Level ($M, 1945-2025)
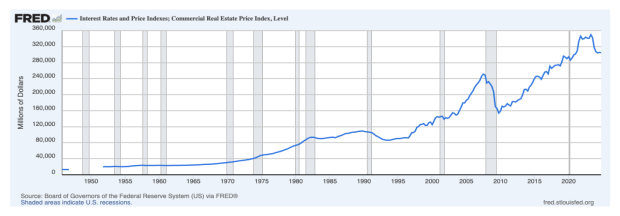
Image Source: Zacks Investment Research
You can see this. The current -10.5% commercial real estate price decline looks more like a necessary price correction to a long-run trend, than a co-incident indicator of a U.S. macro-economic recession.
Now, let’s move onto Household Real Estate. I put up a joint chart 4. This shows U.S. Owner’s Equity in Real Estate has soared to $34.7 trillion dollars. In 2024, the entire U.S. economy came in at $29.7 trillion dollars. In sum, Household Real Estate Equity now amounts to 117% of U.S. GDP.
4. Households: Owners’ Equity in Real Estate (right side, $B) &
S&P Case-Shiller 20-city Composite Home Prices (left side, Index Jan 2000 = 100)
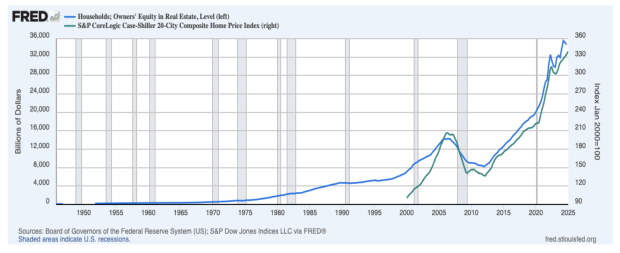
Image Source: Zacks Investment Research
The recovery in own Owner’s Equity in Real Estate, to 72.2% in Q1 of 2025, from a nadir of 46% in Q1 of 2012, is a sight to behold, in chart 5 shown below.
5. Households: Owner’s Equity in Real Estate,
as a Percentage of Household Real Estate (%, 1945-2025)
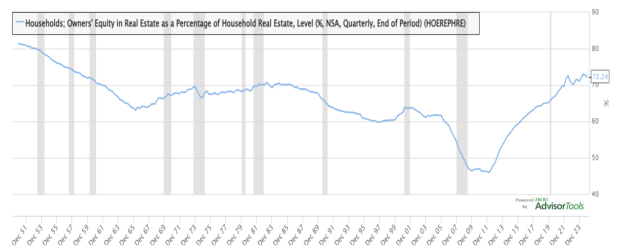
Image Source: Zacks Investment Research
As this long timeline of U.S. history shows, this is above a 60% to 70% Owner’s Equity level seen from 1970 to the Tech Bubble moment of 2000.
The Federal Reserve’s “QE” mortgage-rate and U.S. Treasury bond buying efforts — and multiple years of zero short-term Federal Funds policy interest rates — did indeed pull this spectacular private Homeowner’s Equity recovery off.
This is an excerpt from our most recent Economic Outlook report. To access the full PDF, please click here.
Image: Bigstock
Is a U.S. Real Estate Collapse in the Cards?
This is an excerpt from our most recent Economic Outlook report. To access the full PDF, please click here.
I. Introduction
In this Zacks Econ piece, I want to discuss real estate markets, both commercial and residential.
The reason I want to do this? If a professional economist wants to look deeply for the source of a major U.S. recession, history shows that it can often be found in real estate price collapses.
Capture this sentiment, from chart 1 shown below. Value Added by this active, multi-faceted U.S. Real Estate industry rose to capture 13.8% of the U.S. economy’s total activity in 2025.
1. Value Added by Industry: Finance, Insurance, Real Estate, Rental, and Leasing: Real Estate and Rental and Leasing, as a Percentage of GDP (%, 2005-25)
Image Source: Zacks Investment Research
If real estate prices collapse, a major banking loan crisis often results, initiating a financial market spiral, with wider consequences, seen across the entire U.S. macro-economic system.
Our first stop in this 2025 real estate analysis endeavor will be to check in on the status of both U.S. commercial and residential real estate prices.
You will learn this: there has been an incredible net worth that has been generated by the active Federal Reserve stimulation, of this part of the U.S. economic system.
II. The Status of U.S. Commercial and Residential Real Estate
In our opening St. Louis Fed FRED chart 2 (shown below) you can see Commercial Real Estate Prices for the USA, for the 20 years from 2005 to 2025. Grey areas represent U.S. recessions.
The 2008 real estate and financial crisis is notable, as is the short pandemic shutdown. In the former period, Commercial Real Estate Prices did indeed head south, as the economy entered recession. In COVID, there was a very brief dip into negative prices.
2. Commercial Real Estate Prices for the United States
(annual % change, 2005-2025)
Image Source: Zacks Investment Research
Beginning in Q3-2023, we can note a -10.5% annual decline in commercial real estate prices.
The next chart 3 gives a different, more comforting perspective on this decline, as it shows Commercial Real Estate Index Prices, going back to 1945.
3. U.S. Commercial Real Estate Price Index, Level ($M, 1945-2025)
Image Source: Zacks Investment Research
You can see this. The current -10.5% commercial real estate price decline looks more like a necessary price correction to a long-run trend, than a co-incident indicator of a U.S. macro-economic recession.
Now, let’s move onto Household Real Estate. I put up a joint chart 4. This shows U.S. Owner’s Equity in Real Estate has soared to $34.7 trillion dollars. In 2024, the entire U.S. economy came in at $29.7 trillion dollars. In sum, Household Real Estate Equity now amounts to 117% of U.S. GDP.
4. Households: Owners’ Equity in Real Estate (right side, $B) &
S&P Case-Shiller 20-city Composite Home Prices (left side, Index Jan 2000 = 100)
Image Source: Zacks Investment Research
The recovery in own Owner’s Equity in Real Estate, to 72.2% in Q1 of 2025, from a nadir of 46% in Q1 of 2012, is a sight to behold, in chart 5 shown below.
5. Households: Owner’s Equity in Real Estate,
as a Percentage of Household Real Estate (%, 1945-2025)
Image Source: Zacks Investment Research
As this long timeline of U.S. history shows, this is above a 60% to 70% Owner’s Equity level seen from 1970 to the Tech Bubble moment of 2000.
The Federal Reserve’s “QE” mortgage-rate and U.S. Treasury bond buying efforts — and multiple years of zero short-term Federal Funds policy interest rates — did indeed pull this spectacular private Homeowner’s Equity recovery off.
This is an excerpt from our most recent Economic Outlook report. To access the full PDF, please click here.