This is an excerpt from our most recent Economic Outlook report. To access the full PDF, please click here.
These are frothy times for financial assets.
Data pulled on June 23rd, 2025 from Zacks systems showed:
- The S&P500 LargeCap had a 23.1 P/E using ’25, 20.4 for ’26, and 18.0 on ’27
- The S&P400 MidCap had a 17.7 P/E using ’25, 15.2 for ’26, and 13.5 on ‘27
- The S&P600 SmallCap had a 16.7 P/E using ’25, 14.1 for ’26 and 12.6 on ‘27
Want to endure my stock strategist/economist “wall of worries”?
That 23.1 P/E share valuation ratio for the S&P500 is above the 5-year post-COVID average (19.9) and well above a longer current business cycle 10-year average (18.4).
Does this mean a looming S&P500 share price correction, a shocking bitcoin price correction, or a debilitating U.S. housing price correction, are on the way, later in 2025 or early in 2026?
How about acknowledging a fundamental downside macro catalyst, to all of this? A tariff-induced U.S. recession.
In a moment of inspiration, I thought to ask Google’s Gemini AI tool to answer — to my long list of worries — on 2025 era price excesses.
The following assembled material is what I got back...
I also collected St. Louis Fed (FRED) macro charts, on each topic. I put these time series charts at the back, of each excess AI query section. I added insights too.
Finally, I supply personal closing reflections.
Excesses in Info Tech
Gemini AI: Is the current 2025 stock market circumstance similar to the 2000 internet bubble?
There are indeed some striking similarities between the current stock market circumstances (as of mid-2025) and the 2000 internet bubble, primarily driven by the excitement around Artificial Intelligence (AI).
However, there are also significant differences that suggest the current situation might not lead to a collapse of the same magnitude or nature.
Similarities to the 2000 Internet Bubble:
Transformative Technology Hype: Just as the internet was seen as a revolutionary force in the late 1990s, AI is currently viewed as a transformative technology with the potential to revolutionize industries and drive significant productivity gains. This excitement has fueled massive investments in AI-related companies.
Concentration in Tech: Both periods have seen a significant concentration of market value in a handful of large technology companies. In the late 90s, it was the "dot-coms," and today it's the "Magnificent Seven" (Alphabet, Amazon, Apple, Meta, Microsoft, NVIDIA, and Tesla) that dominate market performance.
Rapid Stock Price Appreciation: The S&P 500 has seen strong back-to-back annual gains, similar to the dot-com era, leading to concerns about overvaluation. Certain AI-related stocks have experienced meteoric rises.
Narrative-Driven Markets: Both periods exhibit markets driven by powerful narratives and "irrational exuberance," where the hype surrounding a nascent industry can outpace realistic assessments of future earnings. Investors, driven by FOMO (fear of missing out), pour money into promising, yet sometimes unproven, ventures.
High Valuations: While not as extreme as the dot-com bubble's peak, current valuations for some tech stocks are considered high, with price-to-earnings (P/E) ratios reflecting significant optimism about future growth.
Key Differences from the 2000 Internet Bubble
Quality of Leading Companies: A crucial difference is the fundamental quality of today's leading tech companies. Many of the "dot-com" companies in 2000 were startups with little to no revenue or clear business plans, often operating at a loss. In contrast, today's AI innovation is largely funded by established tech giants with strong balance sheets, diversified revenue streams, and substantial profits (e.g., Microsoft, Google, Nvidia). This financial robustness provides a cushion against market volatility.
Funding Mechanisms: The dot-com bubble was characterized by a flood of IPOs from unproven companies.Today, a significant portion of new tech investments, especially in AI, is happening in the private equity market.This means these companies can access enormous capital without facing the immediate scrutiny and quarterly earnings pressure of public markets.
Valuation Extremes: While valuations are high, they are generally not as extreme as they were during the dot-com bubble's peak. For instance, the cyclically adjusted price/earnings (CAPE) ratios for the S&P 500 are high but not at the unprecedented levels seen in 2000. Similarly, while mega-cap tech stocks are expensive, their forward price-to-earnings ratios are often significantly lower than the 50-75x multiples seen in 2000.
Macroeconomic Environment: The macroeconomic environment today differs. While there's economic uncertainty and higher inflation, the late 1990s benefited from robust GDP growth, modest inflation, and easing Federal Reserve policies.
Market Structure and Investor Behavior: While skepticism has been present in the current bull run, keeping some retail investors on the sidelines, the dot-com bubble saw widespread retail investor euphoria and sustained stock purchases. The current market, while showing signs of optimism, may not be in the "euphoria" state seen at the peak of the dot-com bubble.
AI Conclusion:
While there are undeniable echoes of the dot-com bubble in the current stock market, particularly in the fervor around AI, it's important to recognize the distinctions.
The underlying fundamentals of many leading tech companies are stronger today, and the market's structure for funding new ventures has evolved.
However, the concentration of market value, the rapid appreciation of certain stocks, and the narrative-driven investing around AI all warrant caution.
Investors should remain disciplined, focus on company fundamentals, and avoid getting swept up in excessive hype.
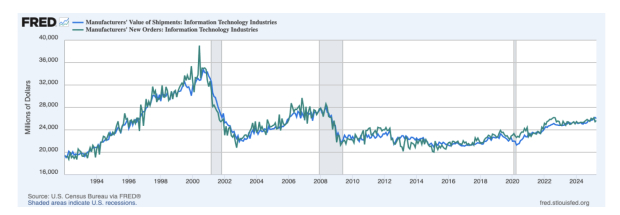
Image Source: St Louis Federal Reserve
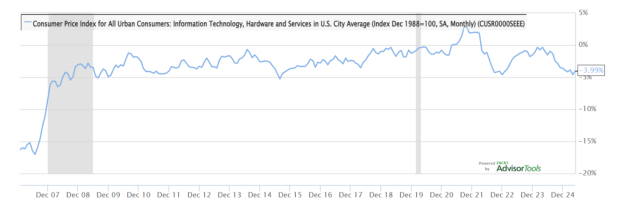
Image Source: Zacks Investment Research
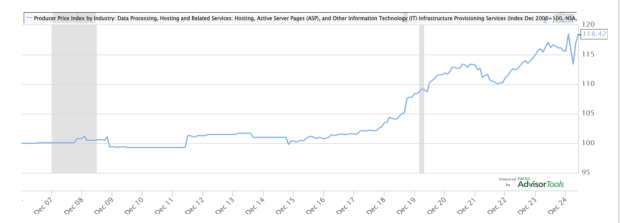
Image Source: Zacks Investment Research
My Chart Observations?
The first chart shows 2025 Info Tech shipments and new orders continue to rise, and look stable.
The second chart shows relentless, ongoing CPI price deflation, for Info Tech hardware and services. That keeps final consumer Info Tech hardware and services demand on the rise.
The third chart’s 2025 PPI price strength — for data processing, hosting, and active server pages — supports all of the newly constructed NVDA AI chip data centers.
That is a source of comfort.
Image: Bigstock
Hunting for Excesses (with AI's Help)
This is an excerpt from our most recent Economic Outlook report. To access the full PDF, please click here.
These are frothy times for financial assets.
Data pulled on June 23rd, 2025 from Zacks systems showed:
Want to endure my stock strategist/economist “wall of worries”?
That 23.1 P/E share valuation ratio for the S&P500 is above the 5-year post-COVID average (19.9) and well above a longer current business cycle 10-year average (18.4).
Does this mean a looming S&P500 share price correction, a shocking bitcoin price correction, or a debilitating U.S. housing price correction, are on the way, later in 2025 or early in 2026?
How about acknowledging a fundamental downside macro catalyst, to all of this? A tariff-induced U.S. recession.
In a moment of inspiration, I thought to ask Google’s Gemini AI tool to answer — to my long list of worries — on 2025 era price excesses.
The following assembled material is what I got back...
I also collected St. Louis Fed (FRED) macro charts, on each topic. I put these time series charts at the back, of each excess AI query section. I added insights too.
Finally, I supply personal closing reflections.
Excesses in Info Tech
Gemini AI: Is the current 2025 stock market circumstance similar to the 2000 internet bubble?
There are indeed some striking similarities between the current stock market circumstances (as of mid-2025) and the 2000 internet bubble, primarily driven by the excitement around Artificial Intelligence (AI).
However, there are also significant differences that suggest the current situation might not lead to a collapse of the same magnitude or nature.
Similarities to the 2000 Internet Bubble:
Transformative Technology Hype: Just as the internet was seen as a revolutionary force in the late 1990s, AI is currently viewed as a transformative technology with the potential to revolutionize industries and drive significant productivity gains. This excitement has fueled massive investments in AI-related companies.
Concentration in Tech: Both periods have seen a significant concentration of market value in a handful of large technology companies. In the late 90s, it was the "dot-coms," and today it's the "Magnificent Seven" (Alphabet, Amazon, Apple, Meta, Microsoft, NVIDIA, and Tesla) that dominate market performance.
Rapid Stock Price Appreciation: The S&P 500 has seen strong back-to-back annual gains, similar to the dot-com era, leading to concerns about overvaluation. Certain AI-related stocks have experienced meteoric rises.
Narrative-Driven Markets: Both periods exhibit markets driven by powerful narratives and "irrational exuberance," where the hype surrounding a nascent industry can outpace realistic assessments of future earnings. Investors, driven by FOMO (fear of missing out), pour money into promising, yet sometimes unproven, ventures.
High Valuations: While not as extreme as the dot-com bubble's peak, current valuations for some tech stocks are considered high, with price-to-earnings (P/E) ratios reflecting significant optimism about future growth.
Key Differences from the 2000 Internet Bubble
Quality of Leading Companies: A crucial difference is the fundamental quality of today's leading tech companies. Many of the "dot-com" companies in 2000 were startups with little to no revenue or clear business plans, often operating at a loss. In contrast, today's AI innovation is largely funded by established tech giants with strong balance sheets, diversified revenue streams, and substantial profits (e.g., Microsoft, Google, Nvidia). This financial robustness provides a cushion against market volatility.
Funding Mechanisms: The dot-com bubble was characterized by a flood of IPOs from unproven companies.Today, a significant portion of new tech investments, especially in AI, is happening in the private equity market.This means these companies can access enormous capital without facing the immediate scrutiny and quarterly earnings pressure of public markets.
Valuation Extremes: While valuations are high, they are generally not as extreme as they were during the dot-com bubble's peak. For instance, the cyclically adjusted price/earnings (CAPE) ratios for the S&P 500 are high but not at the unprecedented levels seen in 2000. Similarly, while mega-cap tech stocks are expensive, their forward price-to-earnings ratios are often significantly lower than the 50-75x multiples seen in 2000.
Macroeconomic Environment: The macroeconomic environment today differs. While there's economic uncertainty and higher inflation, the late 1990s benefited from robust GDP growth, modest inflation, and easing Federal Reserve policies.
Market Structure and Investor Behavior: While skepticism has been present in the current bull run, keeping some retail investors on the sidelines, the dot-com bubble saw widespread retail investor euphoria and sustained stock purchases. The current market, while showing signs of optimism, may not be in the "euphoria" state seen at the peak of the dot-com bubble.
AI Conclusion:
While there are undeniable echoes of the dot-com bubble in the current stock market, particularly in the fervor around AI, it's important to recognize the distinctions.
The underlying fundamentals of many leading tech companies are stronger today, and the market's structure for funding new ventures has evolved.
However, the concentration of market value, the rapid appreciation of certain stocks, and the narrative-driven investing around AI all warrant caution.
Investors should remain disciplined, focus on company fundamentals, and avoid getting swept up in excessive hype.
Image Source: St Louis Federal Reserve
Image Source: Zacks Investment Research
Image Source: Zacks Investment Research
My Chart Observations?
The first chart shows 2025 Info Tech shipments and new orders continue to rise, and look stable.
The second chart shows relentless, ongoing CPI price deflation, for Info Tech hardware and services. That keeps final consumer Info Tech hardware and services demand on the rise.
The third chart’s 2025 PPI price strength — for data processing, hosting, and active server pages — supports all of the newly constructed NVDA AI chip data centers.
That is a source of comfort.