This is an excerpt from our most recent Economic Outlook report. To access the full PDF, please click here.
Can I explain the latest strong real GDP growth numbers of +3.8% for Q2, +4.3% for Q3? I will try.
- First, real GDP growth across 2024 was +2.8%
- Add (-0.5% for Q1) + (+3.8% for Q2) + (4.3% for Q3) = +7.6%/3 = +2.53%
- Real final sales to private domestic purchasers, the sum of consumer spending (C) and gross private fixed investment (I), increased +3.0% in Q3, compared with an increase of +2.9% in Q2
In aggregate, 2025 real GDP growth is very closely tracking 2024, once the intertemporal shifts of consumers, investors, and the trade accounts are smoothed out.
In macro symbols, the 2024 economy (C+I+G+NX) remained in place across 2025.
Want another “nothing is really moving off the 2024 real GDP trend” mark?
Global GDP is projected by Goldman Sachs Research to increase +2.8% in 2026.
Take closer look at the internals of the DEC U.S. CPI report. A balanced dual-mandate driven Fed won’t be happy.
First, the holiday period DEC data is showing the immediate stress being piled onto U.S. consumers, month after month, onto their daily budgets.
Second, the auto price weakness (new or used) is reflecting a weak sales environment. This runs counter to the effects of recent Fed Funds rate cuts.
Six sub- rose the +0.3% m/m average in DEC:
- Food at Home (+0.7%)
- Food Away from Home (+0.7%)
- Apparel (+0.6%)
- Transportation Services (+0.5%)
- Shelter (+0.4%)
- Medical Care Services (+0.4%)
My comment: These are direct consumer purchases of everyday essentials: Food, Clothes, Shelter, Transportation.
One sub-categories rose in line with a modest +0.3% m/m core CPI rise in DEC: Medical Care Commodities (+0.3%)
My comment: Medical Care Commodities and Services are trundling along, in a stable manner, at a high +4.2% y/y rate.
Six sub-categories remained flat, or declined in DEC:
- New Vehicles (+0.0%)
- Electricity (-0.1%)
- Gasoline (-0.5%)
- Used Cars and Trucks (-1.1%)
- Fuel Oil (-1.5%)
- Utility Piped Gas (+4.4%)
My comment: These spending categories — showing weakness — are largely either auto purchases (new or used), or are oil and natural gas price weakness-related.
Heed these lines from the University of Michigan consumer sentiment survey:
“All told, while consumers perceived some modest improvement in the economy over the past two months, their sentiment remains nearly 25% below last January’s reading. They continue to be focused primarily on kitchen table issues, like high prices and softening labor markets.”
Yes, “Liberation Day” tariffs hit the labor markets hard. Ditto the ongoing erratic daily policy tweets. Payroll employment rose by 584,000 in 2025 (an average monthly gain of 49,000), less than the increase of 2.0 million in 2024 (an average monthly gain of 168,000).
The end of ‘emergency’ tariffs, or any replacement of them? That will not change the high level of U.S. economic policy uncertainty one bit. Consult the FRED chart below to confirm that.
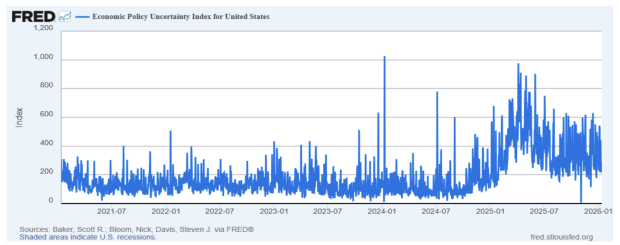
Image Source: St Louis Federal Reserve
Image: Shutterstock
Final U.S. Q3 Real GDP Growth at +4.3%. GDPNow for Q4? +5.1%
This is an excerpt from our most recent Economic Outlook report. To access the full PDF, please click here.
Can I explain the latest strong real GDP growth numbers of +3.8% for Q2, +4.3% for Q3? I will try.
In aggregate, 2025 real GDP growth is very closely tracking 2024, once the intertemporal shifts of consumers, investors, and the trade accounts are smoothed out.
In macro symbols, the 2024 economy (C+I+G+NX) remained in place across 2025.
Want another “nothing is really moving off the 2024 real GDP trend” mark?
Global GDP is projected by Goldman Sachs Research to increase +2.8% in 2026.
Take closer look at the internals of the DEC U.S. CPI report. A balanced dual-mandate driven Fed won’t be happy.
First, the holiday period DEC data is showing the immediate stress being piled onto U.S. consumers, month after month, onto their daily budgets.
Second, the auto price weakness (new or used) is reflecting a weak sales environment. This runs counter to the effects of recent Fed Funds rate cuts.
Six sub- rose the +0.3% m/m average in DEC:
My comment: These are direct consumer purchases of everyday essentials: Food, Clothes, Shelter, Transportation.
One sub-categories rose in line with a modest +0.3% m/m core CPI rise in DEC: Medical Care Commodities (+0.3%)
My comment: Medical Care Commodities and Services are trundling along, in a stable manner, at a high +4.2% y/y rate.
Six sub-categories remained flat, or declined in DEC:
My comment: These spending categories — showing weakness — are largely either auto purchases (new or used), or are oil and natural gas price weakness-related.
Heed these lines from the University of Michigan consumer sentiment survey:
“All told, while consumers perceived some modest improvement in the economy over the past two months, their sentiment remains nearly 25% below last January’s reading. They continue to be focused primarily on kitchen table issues, like high prices and softening labor markets.”
Yes, “Liberation Day” tariffs hit the labor markets hard. Ditto the ongoing erratic daily policy tweets. Payroll employment rose by 584,000 in 2025 (an average monthly gain of 49,000), less than the increase of 2.0 million in 2024 (an average monthly gain of 168,000).
The end of ‘emergency’ tariffs, or any replacement of them? That will not change the high level of U.S. economic policy uncertainty one bit. Consult the FRED chart below to confirm that.
Image Source: St Louis Federal Reserve