The following is an excerpt from Zacks Chief Strategist John Blank’s full Feb Market Strategy report To access the full PDF, click here.
I. U.S. Markets
On Feb. 10th, 2026 the S&P500 value index price momentum is above its 50-day moving average (DMA). The S&P500 blended market weight index is just above it. The S&P500 growth is below it. Consult the Zacks-constructed charts below to confirm this:
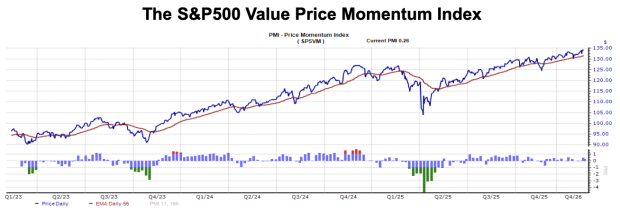
Image Source: Zacks Investment Research

Image Source: Zacks Investment Research
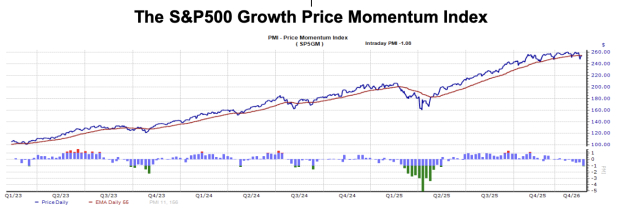
Image Source: Zacks Investment Research
Why is this happening, and should investors be concerned?
What you are seeing — as of Feb. 10th, 2026 — is the textbook definition of a "Great Rotation” — a shift in market leadership where the baton is being passed from the hyper-growth "Artificial Intelligence" stars to the broader, "real economy" sectors.
The divergence between the S&P 500 Value and Growth indices relative to their 50-day moving average (DMA) is a significant technical signal.
Here is why it’s happening and what it means for your portfolio.
Why the Divergence Is Happening
The technical "breakdown" of Growth (trading below its 50 DMA) while Value remains strong (trading above its 50 DMA) is driven by three primary catalysts:
1. The "AI Capex" Fatigue
For the past two years, investors cheered every dollar spent on AI. However, early 2026 has brought a "show me the money" phase.
Consider the latest trigger.
On Feb. 10th, Alphabet shares dropped nearly -2% following a $20 billion bond sale, which intensified fears about the staggering capital expenditures (capex) required to keep the AI race going.
Investors are questioning the immediate ROI for mega-cap tech, leading them to rotate out of Growth — and into sectors with clearer, more traditional cash flows.
2. High Yields and the "Discount Rate" Trap
With the 10-year Treasury yield hovering around 4.22% (the highest level since mid-2025), Growth stocks are under structural pressure.
Growth stocks are "long-duration" assets; their valuations rely on profits far in the future. When interest rates are higher, those future profits are worth less today.
Value sectors like Energy and Financials typically benefit from a higher-rate environment and are less sensitive to these valuation shifts.
3. Broadening Market Breadth
The "blended" market-weighted S&P 500 is sitting just above its 50 DMA because it is being tugged in two directions:
Tech and Growth make up roughly 40% of the index, pulling it down.
Currently, nearly 65% of the S&P 500 components are outperforming the index itself — a level of breadth not seen in years. This "Value" strength in the other 493 stocks is keeping the headline index afloat.
Whether this is "concerning" depends on your time horizon and your current concentration.
The Bull Case: A "Healthy" Market
Most analysts view this as a constructive development.
A market that relies on only seven stocks (the "Magnificent 7") is fragile.
A market where Energy, Materials, and Industrials are leading, while Tech consolidates is much more sustainable.
This rotation suggests the U.S. economy is resilient enough to support "boring" companies, not just tech disruptors.
The Bear Case: A Tech-Led Drag
The danger lies in the concentration risk.
Because the blended market-weight S&P 500 index is market-cap weighted, if the Growth "laggards" (Microsoft, Nvidia, Meta) fall too far below their 50 DMA, they can eventually drag the entire index into a formal correction (a -10% drop), regardless of how well the Value stocks are doing.
II. Zacks February 2026 Sector/Industry/Company Telescope
Jan 30th, 2026 data showed two leaders: Info Tech remains dominant at Very Attractive. Info Tech EPS growth lifts from “AI” chip demand & mega-cap earnings. Industrials rose to a Very Attractive rating from Attractive. The breadth of industry strength here was notable.
Financials stayed Attractive. Records on share indices and Fed policy easing keep the earnings-driven fundamentals strong here. Consumer Staples rose swiftly to Attractive, from a Very Unattractive rating.
Health Care stayed at a Market rating; Medical-Products continued to lead.
Utilities fell to Market Weight from Attractive. “AI” data center demands may be feeling pressured by politics. Communications fell to Market Weight from Attractive. Telco Equipment ranked OK. Consumer Discretionary fell to Market Weight from an Attractive rating.
Materials stayed stuck at an Unattractive rating. Energy sectors fell to a Very Unattractive rating from Attractive. Coal (strangely) led.
(1) Info Tech stayed at Very Attractive. Semis, Electronics, and Misc. Tech led again.
Zacks #1 Rank (STRONG BUY): Micron Technology MU
(2) Industrials rose to Very Attractive from Attractive. Pollution Control and Metal Fabricating were its strongest industries, again.
Zacks #1 Rank (STRONG BUY): GE Aerospace GE
(3) Financials stayed at Attractive. Major Banks and Investment Banking & Brokering looked best.
Zacks #1 Rank (STRONG BUY): Commonwealth Bank of Australia CMWAY
(4) Consumer Staples rose to Attractive from Very Unattractive. But Soaps & Cosmetics, Agri-business, and Food/Drug Retail looked great.
(5) Health Care stayed at Market Weight. Medical Products was best, again.
(6) Utilities fell to Market Weight from Attractive. Utility-Electric Power was the best.
(7) Communications Services fell to Market Weight from Attractive. Telco Equip’t was best, again.
(8) Consumer Discretionary fell to Market Weight from Attractive. Publishing rose to be the best.
(9) Materials stayed at Unattractive. Steel and Metals-non-Ferrous stayed solid (Reflecting high gold and silver prices).
(10) Energy fell to Very Unattractive from Attractive. Coal (oddly) looked the best.
III. Conclusion
A “Great Rotation” inside the S&P500 indices is indeed underway, at the start of 2026.
This will likely remain a significant market trend to play, for some time.
Consult the rest of my Zacks FEB 2026 Market Strategy report — for many more details.
Happy trading and investing.
John Blank, PhD.
Zacks Chief Equity Strategist and Economist


A "Great Rotation" Is Underway: Zacks FEB 2026 Strategy
The following is an excerpt from Zacks Chief Strategist John Blank’s full Feb Market Strategy report To access the full PDF, click here.
I. U.S. Markets
On Feb. 10th, 2026 the S&P500 value index price momentum is above its 50-day moving average (DMA). The S&P500 blended market weight index is just above it. The S&P500 growth is below it. Consult the Zacks-constructed charts below to confirm this:
Image Source: Zacks Investment Research
Image Source: Zacks Investment Research
Image Source: Zacks Investment Research
Why is this happening, and should investors be concerned?
What you are seeing — as of Feb. 10th, 2026 — is the textbook definition of a "Great Rotation” — a shift in market leadership where the baton is being passed from the hyper-growth "Artificial Intelligence" stars to the broader, "real economy" sectors.
The divergence between the S&P 500 Value and Growth indices relative to their 50-day moving average (DMA) is a significant technical signal.
Here is why it’s happening and what it means for your portfolio.
Why the Divergence Is Happening
The technical "breakdown" of Growth (trading below its 50 DMA) while Value remains strong (trading above its 50 DMA) is driven by three primary catalysts:
1. The "AI Capex" Fatigue
For the past two years, investors cheered every dollar spent on AI. However, early 2026 has brought a "show me the money" phase.
Consider the latest trigger.
On Feb. 10th, Alphabet shares dropped nearly -2% following a $20 billion bond sale, which intensified fears about the staggering capital expenditures (capex) required to keep the AI race going.
Investors are questioning the immediate ROI for mega-cap tech, leading them to rotate out of Growth — and into sectors with clearer, more traditional cash flows.
2. High Yields and the "Discount Rate" Trap
With the 10-year Treasury yield hovering around 4.22% (the highest level since mid-2025), Growth stocks are under structural pressure.
Growth stocks are "long-duration" assets; their valuations rely on profits far in the future. When interest rates are higher, those future profits are worth less today.
Value sectors like Energy and Financials typically benefit from a higher-rate environment and are less sensitive to these valuation shifts.
3. Broadening Market Breadth
The "blended" market-weighted S&P 500 is sitting just above its 50 DMA because it is being tugged in two directions:
Tech and Growth make up roughly 40% of the index, pulling it down.
Currently, nearly 65% of the S&P 500 components are outperforming the index itself — a level of breadth not seen in years. This "Value" strength in the other 493 stocks is keeping the headline index afloat.
Whether this is "concerning" depends on your time horizon and your current concentration.
The Bull Case: A "Healthy" Market
Most analysts view this as a constructive development.
A market that relies on only seven stocks (the "Magnificent 7") is fragile.
A market where Energy, Materials, and Industrials are leading, while Tech consolidates is much more sustainable.
This rotation suggests the U.S. economy is resilient enough to support "boring" companies, not just tech disruptors.
The Bear Case: A Tech-Led Drag
The danger lies in the concentration risk.
Because the blended market-weight S&P 500 index is market-cap weighted, if the Growth "laggards" (Microsoft, Nvidia, Meta) fall too far below their 50 DMA, they can eventually drag the entire index into a formal correction (a -10% drop), regardless of how well the Value stocks are doing.
II. Zacks February 2026 Sector/Industry/Company Telescope
Jan 30th, 2026 data showed two leaders: Info Tech remains dominant at Very Attractive. Info Tech EPS growth lifts from “AI” chip demand & mega-cap earnings. Industrials rose to a Very Attractive rating from Attractive. The breadth of industry strength here was notable.
Financials stayed Attractive. Records on share indices and Fed policy easing keep the earnings-driven fundamentals strong here. Consumer Staples rose swiftly to Attractive, from a Very Unattractive rating.
Health Care stayed at a Market rating; Medical-Products continued to lead.
Utilities fell to Market Weight from Attractive. “AI” data center demands may be feeling pressured by politics. Communications fell to Market Weight from Attractive. Telco Equipment ranked OK. Consumer Discretionary fell to Market Weight from an Attractive rating.
Materials stayed stuck at an Unattractive rating. Energy sectors fell to a Very Unattractive rating from Attractive. Coal (strangely) led.
(1) Info Tech stayed at Very Attractive. Semis, Electronics, and Misc. Tech led again.
Zacks #1 Rank (STRONG BUY): Micron Technology MU
(2) Industrials rose to Very Attractive from Attractive. Pollution Control and Metal Fabricating were its strongest industries, again.
Zacks #1 Rank (STRONG BUY): GE Aerospace GE
(3) Financials stayed at Attractive. Major Banks and Investment Banking & Brokering looked best.
Zacks #1 Rank (STRONG BUY): Commonwealth Bank of Australia CMWAY
(4) Consumer Staples rose to Attractive from Very Unattractive. But Soaps & Cosmetics, Agri-business, and Food/Drug Retail looked great.
(5) Health Care stayed at Market Weight. Medical Products was best, again.
(6) Utilities fell to Market Weight from Attractive. Utility-Electric Power was the best.
(7) Communications Services fell to Market Weight from Attractive. Telco Equip’t was best, again.
(8) Consumer Discretionary fell to Market Weight from Attractive. Publishing rose to be the best.
(9) Materials stayed at Unattractive. Steel and Metals-non-Ferrous stayed solid (Reflecting high gold and silver prices).
(10) Energy fell to Very Unattractive from Attractive. Coal (oddly) looked the best.
III. Conclusion
A “Great Rotation” inside the S&P500 indices is indeed underway, at the start of 2026.
This will likely remain a significant market trend to play, for some time.
Consult the rest of my Zacks FEB 2026 Market Strategy report — for many more details.
Happy trading and investing.
John Blank, PhD.
Zacks Chief Equity Strategist and Economist