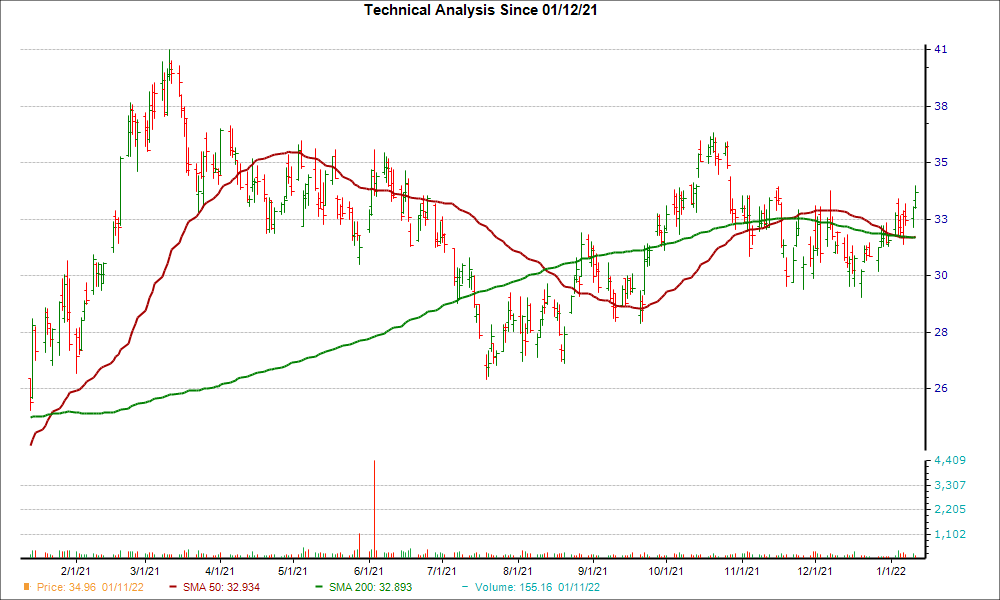
From a technical perspective, HollyFrontier Corporation is looking like an interesting pick, as it just reached a key level of support. HFC's 50-day simple moving average crossed above its 200-day simple moving average, which is known as a "golden cross" in the trading world.
There's a reason traders love a golden cross -- it's a technical chart pattern that can indicate a bullish breakout is on the horizon. This kind of crossover is formed when a stock's short-term moving average breaks above a longer-term moving average. Typically, a golden cross involves the 50-day and the 200-day moving averages, since bigger time periods tend to form stronger breakouts.
There are three stages to a golden cross. First, there must be a downtrend in a stock's price that eventually bottoms out. Then, the stock's shorter moving average crosses over its longer moving average, triggering a positive trend reversal. The third stage is when a stock continues the upward momentum to higher prices.
A golden cross contrasts with a death cross, another widely-followed chart pattern that suggests bearish momentum could be on the horizon.
Shares of HFC have been moving higher over the past four weeks, up 10.2%. Plus, the company is currently a #3 (Hold) on the Zacks Rank, suggesting that HFC could be poised for a breakout.
The bullish case solidifies once investors consider HFC's positive earnings outlook. For the current quarter, no earnings estimate has been cut compared to 2 revisions higher in the past 60 days. The Zacks Consensus Estimate has increased too.
Given this move in earnings estimates and the positive technical factor, investors may want to keep their eye on HFC for more gains in the near future.
Image: Bigstock
HollyFrontier (HFC) Just Flashed Golden Cross Signal: Do You Buy?
From a technical perspective, HollyFrontier Corporation is looking like an interesting pick, as it just reached a key level of support. HFC's 50-day simple moving average crossed above its 200-day simple moving average, which is known as a "golden cross" in the trading world.
There's a reason traders love a golden cross -- it's a technical chart pattern that can indicate a bullish breakout is on the horizon. This kind of crossover is formed when a stock's short-term moving average breaks above a longer-term moving average. Typically, a golden cross involves the 50-day and the 200-day moving averages, since bigger time periods tend to form stronger breakouts.
There are three stages to a golden cross. First, there must be a downtrend in a stock's price that eventually bottoms out. Then, the stock's shorter moving average crosses over its longer moving average, triggering a positive trend reversal. The third stage is when a stock continues the upward momentum to higher prices.
A golden cross contrasts with a death cross, another widely-followed chart pattern that suggests bearish momentum could be on the horizon.
Shares of HFC have been moving higher over the past four weeks, up 10.2%. Plus, the company is currently a #3 (Hold) on the Zacks Rank, suggesting that HFC could be poised for a breakout.
The bullish case solidifies once investors consider HFC's positive earnings outlook. For the current quarter, no earnings estimate has been cut compared to 2 revisions higher in the past 60 days. The Zacks Consensus Estimate has increased too.
Given this move in earnings estimates and the positive technical factor, investors may want to keep their eye on HFC for more gains in the near future.