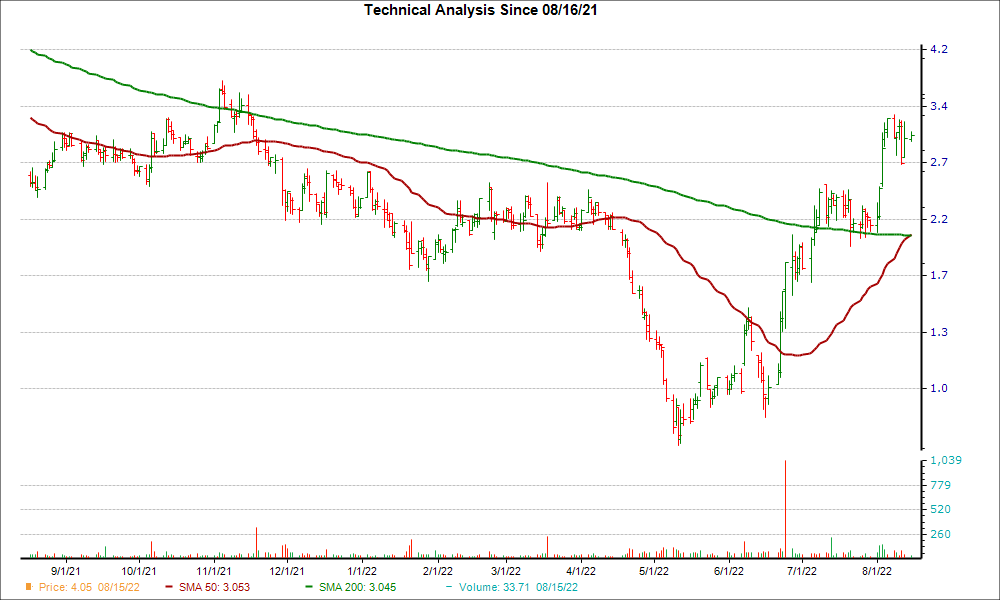
After reaching an important support level, CymaBay Therapeutics Inc. could be a good stock pick from a technical perspective. CBAY recently experienced a "golden cross" event, which saw its 50-day simple moving average breaking out above its 200-day simple moving average.
A golden cross is a technical chart pattern that can signify a potential bullish breakout. It's formed from a crossover involving a security's short-term moving average breaking above a longer-term moving average, with the most common moving averages being the 50-day and the 200-day, since bigger time periods tend to form stronger breakouts.
Golden crosses have three key stages that investors look out for. It starts with a downtrend in a stock's price that eventually bottoms out, followed by the stock's shorter moving average crossing over its longer moving average and triggering a trend reversal. The final stage is when a stock continues the upward climb to higher prices.
A golden cross contrasts with a death cross, another widely-followed chart pattern that suggests bearish momentum could be on the horizon.
CBAY could be on the verge of a breakout after moving 25.8% higher over the last four weeks. Plus, the company is currently a #2 (Buy) on the Zacks Rank.
Once investors consider CBAY's positive earnings outlook for the current quarter, the bullish case only solidifies. No earnings estimate has gone lower in the past two months compared to 5 revisions higher, and the Zacks Consensus Estimate has increased as well.
Investors may want to watch CBAY for more gains in the near future given the company's key technical level and positive earnings estimate revisions.
Image: Bigstock
CymaBay Therapeutics Inc. (CBAY) Just Flashed Golden Cross Signal: Do You Buy?
After reaching an important support level, CymaBay Therapeutics Inc. could be a good stock pick from a technical perspective. CBAY recently experienced a "golden cross" event, which saw its 50-day simple moving average breaking out above its 200-day simple moving average.
A golden cross is a technical chart pattern that can signify a potential bullish breakout. It's formed from a crossover involving a security's short-term moving average breaking above a longer-term moving average, with the most common moving averages being the 50-day and the 200-day, since bigger time periods tend to form stronger breakouts.
Golden crosses have three key stages that investors look out for. It starts with a downtrend in a stock's price that eventually bottoms out, followed by the stock's shorter moving average crossing over its longer moving average and triggering a trend reversal. The final stage is when a stock continues the upward climb to higher prices.
A golden cross contrasts with a death cross, another widely-followed chart pattern that suggests bearish momentum could be on the horizon.
CBAY could be on the verge of a breakout after moving 25.8% higher over the last four weeks. Plus, the company is currently a #2 (Buy) on the Zacks Rank.
Once investors consider CBAY's positive earnings outlook for the current quarter, the bullish case only solidifies. No earnings estimate has gone lower in the past two months compared to 5 revisions higher, and the Zacks Consensus Estimate has increased as well.
Investors may want to watch CBAY for more gains in the near future given the company's key technical level and positive earnings estimate revisions.