It’s easy to point to some of the astronomical returns stocks have seen since the October lows and say that this rally has gone too far, too fast. There are a handful of names that pop off the screen with returns that look as bubblicious as any time in stock market history...
NVIDIA up 188%
Microsoft up 43%
Meta up 181%
I am not here to get into an AI-related argument surrounding margins in tech and what the future of these names holds. Rather, I’m here to give the perspective of the broad market. A broad market which remains very far from overbought, which should lead to even more opportunities to profit over the intermediate to long term.
My Favorite Overbought/Oversold Indicator
My K.I.S.S method for technical analysis relies heavily on the use of the 200-day moving average. It is the most popular moving average in the world, is simple to understand, and easy to apply to any chart. Stocks trading above this average are in a long-term uptrend, stocks trading below this average are in a long-term downtrend.
Early April was the last time I was tasked with our Zacks Confidential piece. In it, I pointed out how the slope in the 200-day had turned positive for the first time in a year, implying that more upside was in store for the market. At that time, the NASDAQ was over 18% off the lows, the Dow nearly 17% and the S&P 500 nearly 15%. Since then, the S&P 500 has rallied another 100 points, the Dow retreated a little more than 400 points and the NASDAQ Composite nearly 1,000 points.
What that tells me is that the rally has been far from uniform. This is not a situation where every single sector continues to rally with the same strength. Rather, it’s been tech leading the way by a large margin, with the rest of the market struggling to keep up. Let’s hit pause on the sector performance for now, and get back to the task at hand, my favorite overbought/oversold indicator:
Percent of Stocks Above 200-Day Average
If the 200-day is so important in determining the long-term trend of any singular stock, then it’s a great idea to aggregate this data for the broad market. Rather than looking at an individual stock to see where it’s trading in relation to that 200-day, let’s package it all up and see what percentage of stocks out there in the universe are trading above their respective 200-day moving averages.
The thought process here is that when the market is oversold, a vast majority of stocks will be trading below their 200-day moving averages. Conversely, when the market is overbought, a vast majority of stocks will be trading above their 200-day moving averages.
The data checks out. During periods where the market bottomed, oftentimes the percentage of stocks above their 200-day moving averages reaches levels under 15%. There are extremes like the Financial Crisis where that number got below 5%. During the COVID lows, the number reached 4.7%. The most recent downtick in the market and relative bottom in October 2022 saw levels down at 15%.
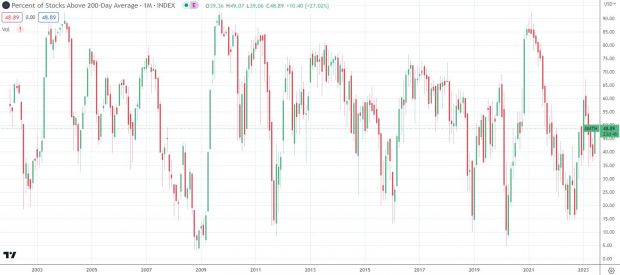
Image Source: TradingView
Currently, the level sits at 40.3%. That means that only 2 out of every 5 stocks out there are in a long-term uptrend. Typically, for the market to be top-heavy that number needs to be over 70%. The previous all-time stock market highs saw that number over 90%. We are very far from that situation right now. That tells me that there are lots of stocks that are not yet participating in this rally and that the overall bullish pattern could last for a much longer period than folks are expecting.
The “In-Crowd”
Over the course of that rally off the October lows, something has been painfully obvious. There are two sectors of the market which are absolutely killing it, while the rest are continually under pressure. Looking back at the last six months, Technology is up 21.81% and Communications Services 20.53%. The only other sector in the green is the Consumer Cyclical sector which is up only 5.35%.
The rest goes from ugly to uglier. Industrial have shed 1.6%, Healthcare 2% and Consumer Defensive 3.3%. You would think that the banking crisis in the regionals would really have the Financial Sector in deep distress, but it is only off 5%. Basic Materials are right with it at 5%. The boring Utilities are hit by higher rates, leading to a 7.2% decline. Real Estate has not quite been the worst but is close at 8.3% to the downside. Then, the Belle of the Ball last year, Energy, is in the toilet bowl during the last six months, off 10.9%.
The results have really stretched out valuations for some sectors while making others feel like absolute bargains. The Forward PE on the Tech Sector is up at 23.85x, not terribly eye-watering given the growth prospects there. It is still cheaper on a forward basis than the Real Estate Sector which is at 26.54x. The cheapest sector looks like a typo. Utilities might be trading at 21.7x trailing PE, but push that forward and the sector is only 2.9x.
Getting it Together
This quick analysis has given us a few bullet points to work off:
• Tech is hot but cheaper than I expected
• The broad market is far from overbought
• Utilities are on fire sale
With this thesis in place, it is time to shop. I start by pulling up our Zacks Sector Rank tab and go to work. Our Sector Rank breaks the market down into 16 distinct sectors, allowing us to hone in a little more specifically than the broad 11 sectors the Global Industry Classification Standard uses.
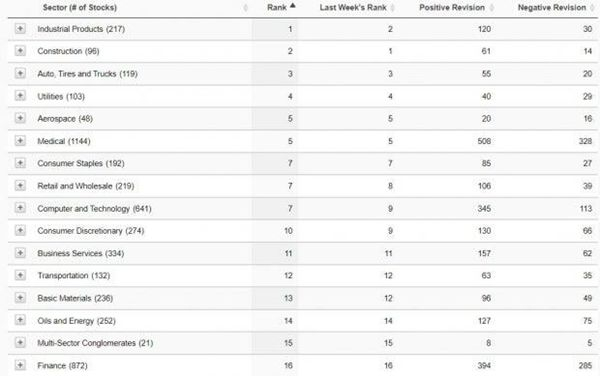
Image Source: Zacks Investment Research
Here I see the strength of the recent earnings estimate revisions coming from analysts all over Wall Street. What jumps out at me is that while Utilities are on sale, estimate revisions continue to come in on the upside. Compare that to the situation in Energy, where analysts are not as bullish and the valuations are still down. This smells like an opportunity in Utilities to me. By expanding this tab, I can see that the Electric Power industry has had 29 positive revisions and only 9 negative revisions lately.
Also, the Electric Construction industry is in the Top 3% of our Zacks Industry Rank. It would make sense that if Utility companies are making a lot more money that they would invest a good chunk of those profits into upgrading the infrastructure, helping to lower their costs in the future. It’s wise to make moves like that when business is good, sacrificing profits today, rather than struggling to bandage up things when times get lean.
3 Tickers to Win Big in a Surprising Sector
Utilities may not be a category that fires the blood, but making money in the stock market sure does.
So enough with the teasing already, here are a few names I have sorted out which have great potential in this sector. Should the market become worried about PEs, which ultimately it will, these stocks will be in a wonderful position to take advantage of the rotation.
Stock #1: Emerging market pick with a whopping earnings forecast.
Stock #2: They handle electrical installations of any type and size. Electrical Construction doesn’t sound sexy but it’s in the top 3% of the Zacks Industry Rank.
Stock #3: Estimates are “out of this world.” EPS growth predicted at +100% this year and +300% next year.
Click here for the names of these three stocks >>
But that’s not all.
You’ll also get full 30-day, real-time access to ALL Zacks’ private buys & sells as part of our celebrated Zacks Ultimate service.
Don't miss your chance to follow our real-time moves from ready-to-fly stocks under $10 to professional options trades… from insider buys to long-term value stocks… from home run investments to income recommendations.
In fact, Zacks Ultimate closed 176 double- and triple-digit gains last year and already 64 more in 2023. Gains reached as high as +244.0%, +348.7% and even +1,007.1%.¹
Your cost for all this is only $1, and there’s not 1 cent of obligation to spend anything more.
Important: The number of investors who will see the three stocks and many others must be limited. Your chance to take full advantage ends at midnight Thursday, June 8.
Click for 3 Tickers to Win Big in a Surprising Sector and to start your 30-day Zacks Ultimate $1 trial >>
All the Best,
Dave
Dave Bartosiak is the Editor of Zacks Surprise Trader and Zacks Blockchain Innovators.
¹ The results are not (or may not be) representative of the performance of all selections made by Zacks Investment Research's newsletter editors.


Image: Bigstock
Should You Jump on This Rally?
It’s easy to point to some of the astronomical returns stocks have seen since the October lows and say that this rally has gone too far, too fast. There are a handful of names that pop off the screen with returns that look as bubblicious as any time in stock market history...


NVIDIA up 188%
Microsoft up 43%
Meta up 181%
I am not here to get into an AI-related argument surrounding margins in tech and what the future of these names holds. Rather, I’m here to give the perspective of the broad market. A broad market which remains very far from overbought, which should lead to even more opportunities to profit over the intermediate to long term.
My Favorite Overbought/Oversold Indicator
My K.I.S.S method for technical analysis relies heavily on the use of the 200-day moving average. It is the most popular moving average in the world, is simple to understand, and easy to apply to any chart. Stocks trading above this average are in a long-term uptrend, stocks trading below this average are in a long-term downtrend.
Early April was the last time I was tasked with our Zacks Confidential piece. In it, I pointed out how the slope in the 200-day had turned positive for the first time in a year, implying that more upside was in store for the market. At that time, the NASDAQ was over 18% off the lows, the Dow nearly 17% and the S&P 500 nearly 15%. Since then, the S&P 500 has rallied another 100 points, the Dow retreated a little more than 400 points and the NASDAQ Composite nearly 1,000 points.
What that tells me is that the rally has been far from uniform. This is not a situation where every single sector continues to rally with the same strength. Rather, it’s been tech leading the way by a large margin, with the rest of the market struggling to keep up. Let’s hit pause on the sector performance for now, and get back to the task at hand, my favorite overbought/oversold indicator:
Percent of Stocks Above 200-Day Average
If the 200-day is so important in determining the long-term trend of any singular stock, then it’s a great idea to aggregate this data for the broad market. Rather than looking at an individual stock to see where it’s trading in relation to that 200-day, let’s package it all up and see what percentage of stocks out there in the universe are trading above their respective 200-day moving averages.
The thought process here is that when the market is oversold, a vast majority of stocks will be trading below their 200-day moving averages. Conversely, when the market is overbought, a vast majority of stocks will be trading above their 200-day moving averages.
The data checks out. During periods where the market bottomed, oftentimes the percentage of stocks above their 200-day moving averages reaches levels under 15%. There are extremes like the Financial Crisis where that number got below 5%. During the COVID lows, the number reached 4.7%. The most recent downtick in the market and relative bottom in October 2022 saw levels down at 15%.
Image Source: TradingView
Currently, the level sits at 40.3%. That means that only 2 out of every 5 stocks out there are in a long-term uptrend. Typically, for the market to be top-heavy that number needs to be over 70%. The previous all-time stock market highs saw that number over 90%. We are very far from that situation right now. That tells me that there are lots of stocks that are not yet participating in this rally and that the overall bullish pattern could last for a much longer period than folks are expecting.
The “In-Crowd”
Over the course of that rally off the October lows, something has been painfully obvious. There are two sectors of the market which are absolutely killing it, while the rest are continually under pressure. Looking back at the last six months, Technology is up 21.81% and Communications Services 20.53%. The only other sector in the green is the Consumer Cyclical sector which is up only 5.35%.
The rest goes from ugly to uglier. Industrial have shed 1.6%, Healthcare 2% and Consumer Defensive 3.3%. You would think that the banking crisis in the regionals would really have the Financial Sector in deep distress, but it is only off 5%. Basic Materials are right with it at 5%. The boring Utilities are hit by higher rates, leading to a 7.2% decline. Real Estate has not quite been the worst but is close at 8.3% to the downside. Then, the Belle of the Ball last year, Energy, is in the toilet bowl during the last six months, off 10.9%.
The results have really stretched out valuations for some sectors while making others feel like absolute bargains. The Forward PE on the Tech Sector is up at 23.85x, not terribly eye-watering given the growth prospects there. It is still cheaper on a forward basis than the Real Estate Sector which is at 26.54x. The cheapest sector looks like a typo. Utilities might be trading at 21.7x trailing PE, but push that forward and the sector is only 2.9x.
Getting it Together
This quick analysis has given us a few bullet points to work off:
• Tech is hot but cheaper than I expected
• The broad market is far from overbought
• Utilities are on fire sale
With this thesis in place, it is time to shop. I start by pulling up our Zacks Sector Rank tab and go to work. Our Sector Rank breaks the market down into 16 distinct sectors, allowing us to hone in a little more specifically than the broad 11 sectors the Global Industry Classification Standard uses.
Image Source: Zacks Investment Research
Here I see the strength of the recent earnings estimate revisions coming from analysts all over Wall Street. What jumps out at me is that while Utilities are on sale, estimate revisions continue to come in on the upside. Compare that to the situation in Energy, where analysts are not as bullish and the valuations are still down. This smells like an opportunity in Utilities to me. By expanding this tab, I can see that the Electric Power industry has had 29 positive revisions and only 9 negative revisions lately.
Also, the Electric Construction industry is in the Top 3% of our Zacks Industry Rank. It would make sense that if Utility companies are making a lot more money that they would invest a good chunk of those profits into upgrading the infrastructure, helping to lower their costs in the future. It’s wise to make moves like that when business is good, sacrificing profits today, rather than struggling to bandage up things when times get lean.
3 Tickers to Win Big in a Surprising Sector
Utilities may not be a category that fires the blood, but making money in the stock market sure does.
So enough with the teasing already, here are a few names I have sorted out which have great potential in this sector. Should the market become worried about PEs, which ultimately it will, these stocks will be in a wonderful position to take advantage of the rotation.
Stock #1: Emerging market pick with a whopping earnings forecast.
Stock #2: They handle electrical installations of any type and size. Electrical Construction doesn’t sound sexy but it’s in the top 3% of the Zacks Industry Rank.
Stock #3: Estimates are “out of this world.” EPS growth predicted at +100% this year and +300% next year.
Click here for the names of these three stocks >>
But that’s not all.
You’ll also get full 30-day, real-time access to ALL Zacks’ private buys & sells as part of our celebrated Zacks Ultimate service.
Don't miss your chance to follow our real-time moves from ready-to-fly stocks under $10 to professional options trades… from insider buys to long-term value stocks… from home run investments to income recommendations.
In fact, Zacks Ultimate closed 176 double- and triple-digit gains last year and already 64 more in 2023. Gains reached as high as +244.0%, +348.7% and even +1,007.1%.¹
Your cost for all this is only $1, and there’s not 1 cent of obligation to spend anything more.
Important: The number of investors who will see the three stocks and many others must be limited. Your chance to take full advantage ends at midnight Thursday, June 8.
Click for 3 Tickers to Win Big in a Surprising Sector and to start your 30-day Zacks Ultimate $1 trial >>
All the Best,
Dave
Dave Bartosiak is the Editor of Zacks Surprise Trader and Zacks Blockchain Innovators.
¹ The results are not (or may not be) representative of the performance of all selections made by Zacks Investment Research's newsletter editors.