CAT delivered higher revenues, marking a return to positive growth after six consecutive quarters of declines, which was driven by increased volumes across all segments. These gains were, however, partially offset by elevated tariff-related costs.
Including one-time items, Caterpillar’s earnings per share were $4.88, a 4% decline from the reported figure of $5.06 in the year-ago quarter.
Caterpillar Inc. Price, Consensus and EPS Surprise

Caterpillar Inc. price-consensus-eps-surprise-chart | Caterpillar Inc. Quote
CAT’s Q3 Revenues Up on Higher Volumes in All Segments
Caterpillar reported revenues of around $17.6 billion, which surpassed the Zacks Consensus Estimate of $16.75 billion by a margin of 5.33%. The company achieved growth across all segments, with the figure representing an all-time quarterly record.
The top line increased 9.5% year over year due to higher sales volume of $1.55 billion (around 10%). This was attributed to improved sales volume in each of its segments, reflecting higher sales of equipment to end users. This was somewhat offset by unfavorable price realization of $191 million (1.3%) and favorable currency impact of $132 million or 1%.
Our model had projected volume growth of 4.5%, an unfavorable price impact of 0.6% and a negative currency impact of 0.4%.
Caterpillar witnessed revenue growth in all regions, led by 13% in North America, followed by 10% in Latin America, 7% in Asia Pacific and 1% in EAME.
Caterpillar reported a sequential backlog growth of $2.4 billion in the quarter. Its backlog is currently at an all-time high of $39.9 billion.
Caterpillar’s Q3 Profits Pressured by Tariffs & Expenses
Cost of sales increased 16% year over year to approximately $11.7 billion, primarily driven by unfavorable manufacturing costs, including the impact of higher tariffs.
Gross profit was down 1.2% to $5.97 billion from the prior-year quarter. The gross margin was 33.8% compared with 37.5% in the year-ago quarter.
Selling, general and administrative (SG&A) expenses moved up 9.2% year over year to around $1.82 billion due to higher compensation expense. Research and development (R&D) expenses were up 4% to $555 million.
CAT reported an operating profit of $3.05 billion, a 3% decline from the year-ago quarter. Unfavorable price realization, elevated manufacturing costs and SG&A and R&D expenses offset the gains from higher volumes. The operating margin was 17.3%, a 220-basis-point contraction from the year-ago quarter.
Adjusted operating profit was around $3.09 billion, down 4% from the year-ago quarter. The adjusted operating margin was 17.5% compared with 20% in the third quarter of 2024.
CAT’s Segment Performances in Q3
Machinery and Energy & Transportation (ME&T) sales rose 10% year over year to around $16.7 billion, attributed to higher volumes on increased sales of equipment to end users.
Construction Industries' total sales were up 7% year over year to $6.76 billion on higher sales volume and favorable currency impact, offset by unfavorable price realization.
Regionally, sales were up 8% in North America, 6% in EAME and 3% in Asia/Pacific, which was offset by a 1% dip in Latin America. The segment’s total sales were a bit higher than our estimate of $6.75 billion.
Total sales in the Resource Industries segment were up 2% year over year to $3.11 billion. Sales in EAME, Latin America and North America were up 22%, 9% and 1%, respectively, but were offset by an 8% decline in sales in Asia/Pacific. The segment’s third-quarter total sales were a bit higher than our projection of $3.04 billion.
Sales of the Energy & Transportation segment were around $8.4 billion, a 17% increase from last year’s quarter, aided by higher sales volumes, favorable currency impacts and price realization. Our estimate for the segment’s sales for the quarter was $7.34 billion.
The segment reported sales growth in Power Generation (31%), Oil and Gas sector (20%) and 5% growth in both the Industrial and Transportation sectors. Regionally, a 27% sales increase in Asia/Pacific, 26% in North America and 24% in Latin America were offset by decreases of 8% in EAME.
The ME&T segment reported an operating profit of around $3 billion, down 3% year over year. Our model’s projection was $2.4 billion.
The Energy & Transportation segment reported a 17% year-over-year increase in operating profit to $1.68 billion, higher than our estimate of $1.53 billion.
The Construction Industries segment’s operating profit was down 7% year over year to $1.38 billion. Our projection was $1.55 billion.
The Resource Industries segment’s operating profit slumped 19% year over year to around $0.5 billion. Our estimate for the segment’s operating profit was $0.62 billion.
Financial Products’ total revenues rose 4% from the year-ago quarter to $1.08 billion. The segment reported a profit of $241 million, marking a 2% decline year over year. Our model had projected revenues of $1.08 billion and an operating profit of $248 million for the third quarter of 2025.
Caterpillar’s Cash Position
Caterpillar generated an operating cash flow of $8.15 billion in the first nine-month period of 2025 compared with $8.64 billion in the prior-year comparable period.
The company returned around $1.1 billion in cash to shareholders as dividends and share repurchases through the third quarter. CAT ended the quarter with cash and equivalents of around $7.5 billion, higher than the cash holding of around $6.9 billion at 2024-end.
CAT’s Expectations for Q425 & 2025
The company anticipates revenues in the fourth quarter of 2025 to grow at a solid pace year over year. CAT anticipates $650-$800 million in headwind from tariffs for the quarter.
Adjusted operating margin is anticipated to be higher year over year, excluding tariff impact. However, including the impact of tariffs, the adjusted operating margin will be lower than the year-ago quarter.
CAT now expects 2025 revenues to be “modestly” higher compared with 2024, an improvement from its prior projection of “slightly” higher revenues.
The company projects net incremental tariffs of around $1.6-$1.75 billion for 2025. CAT outlined its outlook for 2025 operating margins for both scenarios, including and excluding tariffs.
Excluding tariffs, adjusted operating margin is expected to be in the top half of its target range, corresponding to the anticipated level of revenues. Considering the impact of tariffs, Caterpillar expects the adjusted operating margin to be near the bottom of its target range.
The company maintains its revenue projection at $42-$72 billion, and margins are anticipated between 10% and 22%, corresponding to the respective revenue levels, as shown in the chart below.
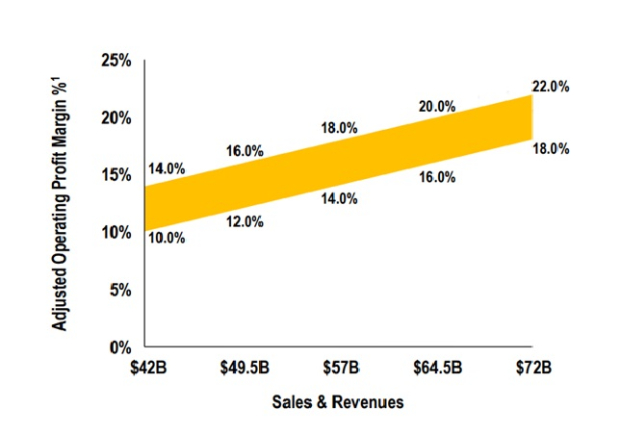 Image Source: Caterpillar Inc.
Caterpillar expects ME&T free cash flow in 2025 to be above the midpoint of its targeted range of $5-$10 billion.
The consensus estimate for Terex’s revenues for the quarter is $1.4 billion, suggesting 15.5% growth from the year-ago quarter.
The consensus estimate for Astec’s top line is pegged at $336 million, indicating a 15% rise from the prior year’s actual.


Image: Bigstock
CAT Q3 Earnings & Revenues Beat Estimates on Higher Volumes
Key Takeaways
Caterpillar Inc. (CAT - Free Report) reported adjusted earnings per share of $4.95 for the third quarter of 2025, which beat the Zacks Consensus Estimate of $4.52 by a margin of 10%. The bottom line was, however, down 4% compared with the year-ago quarter.
CAT delivered higher revenues, marking a return to positive growth after six consecutive quarters of declines, which was driven by increased volumes across all segments. These gains were, however, partially offset by elevated tariff-related costs.
Including one-time items, Caterpillar’s earnings per share were $4.88, a 4% decline from the reported figure of $5.06 in the year-ago quarter.
Caterpillar Inc. Price, Consensus and EPS Surprise
Caterpillar Inc. price-consensus-eps-surprise-chart | Caterpillar Inc. Quote
CAT’s Q3 Revenues Up on Higher Volumes in All Segments
Caterpillar reported revenues of around $17.6 billion, which surpassed the Zacks Consensus Estimate of $16.75 billion by a margin of 5.33%. The company achieved growth across all segments, with the figure representing an all-time quarterly record.
The top line increased 9.5% year over year due to higher sales volume of $1.55 billion (around 10%). This was attributed to improved sales volume in each of its segments, reflecting higher sales of equipment to end users. This was somewhat offset by unfavorable price realization of $191 million (1.3%) and favorable currency impact of $132 million or 1%.
Our model had projected volume growth of 4.5%, an unfavorable price impact of 0.6% and a negative currency impact of 0.4%.
Caterpillar witnessed revenue growth in all regions, led by 13% in North America, followed by 10% in Latin America, 7% in Asia Pacific and 1% in EAME.
Caterpillar reported a sequential backlog growth of $2.4 billion in the quarter. Its backlog is currently at an all-time high of $39.9 billion.
Caterpillar’s Q3 Profits Pressured by Tariffs & Expenses
Cost of sales increased 16% year over year to approximately $11.7 billion, primarily driven by unfavorable manufacturing costs, including the impact of higher tariffs.
Gross profit was down 1.2% to $5.97 billion from the prior-year quarter. The gross margin was 33.8% compared with 37.5% in the year-ago quarter.
Selling, general and administrative (SG&A) expenses moved up 9.2% year over year to around $1.82 billion due to higher compensation expense. Research and development (R&D) expenses were up 4% to $555 million.
CAT reported an operating profit of $3.05 billion, a 3% decline from the year-ago quarter. Unfavorable price realization, elevated manufacturing costs and SG&A and R&D expenses offset the gains from higher volumes. The operating margin was 17.3%, a 220-basis-point contraction from the year-ago quarter.
Adjusted operating profit was around $3.09 billion, down 4% from the year-ago quarter. The adjusted operating margin was 17.5% compared with 20% in the third quarter of 2024.
CAT’s Segment Performances in Q3
Machinery and Energy & Transportation (ME&T) sales rose 10% year over year to around $16.7 billion, attributed to higher volumes on increased sales of equipment to end users.
Construction Industries' total sales were up 7% year over year to $6.76 billion on higher sales volume and favorable currency impact, offset by unfavorable price realization.
Regionally, sales were up 8% in North America, 6% in EAME and 3% in Asia/Pacific, which was offset by a 1% dip in Latin America. The segment’s total sales were a bit higher than our estimate of $6.75 billion.
Total sales in the Resource Industries segment were up 2% year over year to $3.11 billion. Sales in EAME, Latin America and North America were up 22%, 9% and 1%, respectively, but were offset by an 8% decline in sales in Asia/Pacific. The segment’s third-quarter total sales were a bit higher than our projection of $3.04 billion.
Sales of the Energy & Transportation segment were around $8.4 billion, a 17% increase from last year’s quarter, aided by higher sales volumes, favorable currency impacts and price realization. Our estimate for the segment’s sales for the quarter was $7.34 billion.
The segment reported sales growth in Power Generation (31%), Oil and Gas sector (20%) and 5% growth in both the Industrial and Transportation sectors. Regionally, a 27% sales increase in Asia/Pacific, 26% in North America and 24% in Latin America were offset by decreases of 8% in EAME.
The ME&T segment reported an operating profit of around $3 billion, down 3% year over year. Our model’s projection was $2.4 billion.
The Energy & Transportation segment reported a 17% year-over-year increase in operating profit to $1.68 billion, higher than our estimate of $1.53 billion.
The Construction Industries segment’s operating profit was down 7% year over year to $1.38 billion. Our projection was $1.55 billion.
The Resource Industries segment’s operating profit slumped 19% year over year to around $0.5 billion. Our estimate for the segment’s operating profit was $0.62 billion.
Financial Products’ total revenues rose 4% from the year-ago quarter to $1.08 billion. The segment reported a profit of $241 million, marking a 2% decline year over year. Our model had projected revenues of $1.08 billion and an operating profit of $248 million for the third quarter of 2025.
Caterpillar’s Cash Position
Caterpillar generated an operating cash flow of $8.15 billion in the first nine-month period of 2025 compared with $8.64 billion in the prior-year comparable period.
The company returned around $1.1 billion in cash to shareholders as dividends and share repurchases through the third quarter. CAT ended the quarter with cash and equivalents of around $7.5 billion, higher than the cash holding of around $6.9 billion at 2024-end.
CAT’s Expectations for Q425 & 2025
The company anticipates revenues in the fourth quarter of 2025 to grow at a solid pace year over year. CAT anticipates $650-$800 million in headwind from tariffs for the quarter.
Adjusted operating margin is anticipated to be higher year over year, excluding tariff impact. However, including the impact of tariffs, the adjusted operating margin will be lower than the year-ago quarter.
CAT now expects 2025 revenues to be “modestly” higher compared with 2024, an improvement from its prior projection of “slightly” higher revenues.
The company projects net incremental tariffs of around $1.6-$1.75 billion for 2025. CAT outlined its outlook for 2025 operating margins for both scenarios, including and excluding tariffs.
Excluding tariffs, adjusted operating margin is expected to be in the top half of its target range, corresponding to the anticipated level of revenues. Considering the impact of tariffs, Caterpillar expects the adjusted operating margin to be near the bottom of its target range.
The company maintains its revenue projection at $42-$72 billion, and margins are anticipated between 10% and 22%, corresponding to the respective revenue levels, as shown in the chart below.
Caterpillar expects ME&T free cash flow in 2025 to be above the midpoint of its targeted range of $5-$10 billion.
Caterpillar Stock’s Price Performance & Zacks Rank
Over the past year, Caterpillar stock has gained 38.3% compared with the industry’s 37.3% growth.
Image Source: Zacks Investment Research
Caterpillar carries a Zacks Rank #3 (Hold) at present. You can see the complete list of today's Zacks #1 Rank (Strong Buy) stocks here.
Other Manufacturing & Construction Stock Awaiting Results
Terex Corporation (TEX - Free Report) is slated to release third-quarter 2025 results on Oct. 30. The Zacks Consensus Estimate for Terex’s third-quarter 2025 earnings is pegged at $1.22 per share, suggesting a year-over-year decline of 16.4%. Terex has a trailing four-quarter average surprise of 22.3%.
The consensus estimate for Terex’s revenues for the quarter is $1.4 billion, suggesting 15.5% growth from the year-ago quarter.
Komatsu (KMTUY - Free Report) is expected to report its third-quarter 2025 results next week. The Zacks Consensus Estimate for Komatsu’s quarterly earnings is currently pegged at 63 cents per share. This suggests a 6% decline from the year-ago quarter. Komatsu has a trailing four-quarter average surprise of 22.7%.
Astec Industries (ASTE - Free Report) is set to release its third-quarter 2025 results on Nov. 5. The Zacks Consensus Estimate for Astec’s earnings is pegged at 45 cents per share, indicating 45% growth from the year-ago quarter.
The consensus estimate for Astec’s top line is pegged at $336 million, indicating a 15% rise from the prior year’s actual.