This is an excerpt from our most recent Economic Outlook report. To access the full PDF, please click here.
Corporate profits have never been fatter — or accounted for a bigger portion of the overall U.S. economy.
One reason?
Companies were able to boost prices amid global supply chain shortages, leaving both U.S. and global consumers paying more for everything, from gasoline to food to toys. Corporate expenses haven't climbed as quickly, even as firms grapple with labor shortages and higher wages.
(1) Consider U.S. Corporate After-tax Profits in the National Accounts.
These recently made up about 11.7% of GDP, a measure experts typically use to gauge the nation's economic health. It's been nearly a decade since that proportion was even close, according to Bureau of Economic Analysis (BEA) figures.
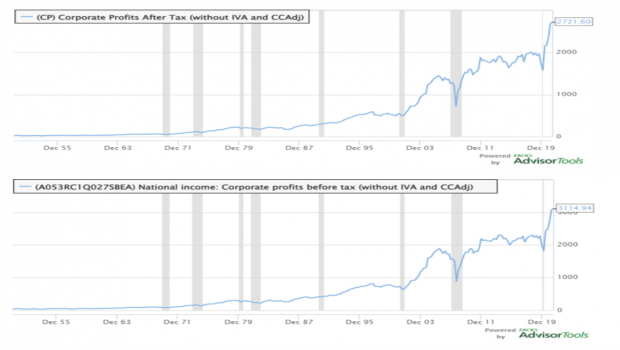 Image Source: Zacks Investment Research
This parallels the large-cap U.S. multi-national stock ticker story. According to Zacks Research Director Sheraz Mian’s latest data, Q4-2021 S&P500 quarterly net margins are coming in at 12.8%. The S&P500 Net Margin peaked at 13.4% in Q3-2021.
If you are looking for a very detailed comparison of these two profit data sets, the stock strategist Dr. Edward Yardeni puts out an updated 19-page booklet for you. Click the link to explore that: Corporate Finance Briefing: NIPA vs. S&P500 Profits
(2) Note this fascinating macro detail, too:
The little understood Inventory Valuation Adjustment (IVA) for 2021 was around $300B, inside U.S. GDP accounts in 2021 given the supply chain depletion.
This is typically a National Accounts adjustment which floats closer to $30B each year.
Why?
Supply chain depletions radically reduced U.S. corporate inventories, which were sold at a hefty profit during this pandemic.
Warehouses, restaurants, retail outfits, you name it — they all struggled mightily to stock inventory, given the Los Angeles-Long Beach port backups.
A second adjustment macro-economists typically make, didn’t make for much added change to corporate profits.
The Capital Consumption Adjustment (CCA) was around $50B in 2021, which is more or less consistent with a longer time series.
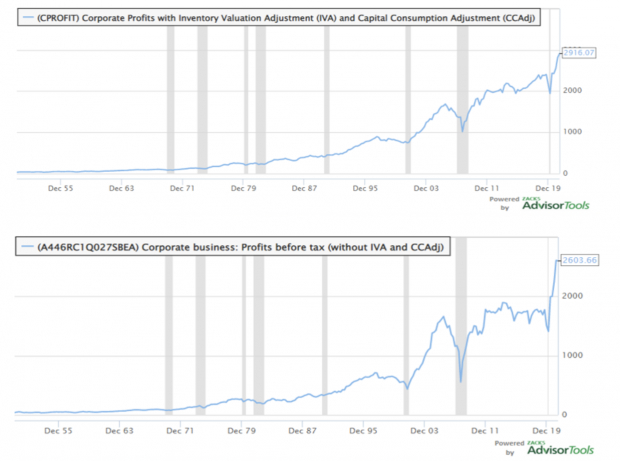 Image Source: Zacks Investment Research
Here is how the U.S. Bureau of Economic Analysis (BEA) defines those 2 terms--
(A) Inventory Valuation Adjustment (IVA): An adjustment made in the national income and product accounts (NIPAs) to corporate profits and to proprietors' income in order to remove inventory "profits," which are more like a capital-gain than profits from current production.
(B) Capital Consumption Adjustment (CCAdj.): The difference between private capital consumption allowances (CCA) and private consumption of fixed capital (CFC).
CCA: Consists of tax-return-based depreciation charges for corporations and nonfarm proprietorships and of historical-cost depreciation (calculated by BEA) for farm proprietorships, rental income of persons and nonprofit institutions.
CFC: The charge for the using up of private and government fixed capital located in the United States. It is the decline in the value of the stock of fixed assets due to wear and tear, obsolescence, accidental damage and aging. For general government and for nonprofit institutions that primarily serve individuals, CFC serves as a measure of the value of the current services of the fixed assets owned and used by these entities.
The net of those arcane GDP subtractions made up for the difference in the two charts I presented to you.
(3) Another element of study to account for here?
Remove corporate banking profits from overall U.S. profit accounting.
Then, we can just focus on what is known as Nonfinancial Corporate Business Profits. Those are the actual producers inside the massive U.S. economy.
I show these metrics next.
The first chart shows absolute Nonfinancial Corporate Profits boom. It went vertical.
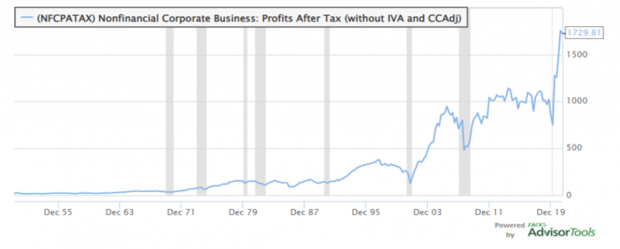 Image Source: Zacks Investment Research
The second chart displays Profit per Unit of Real Gross Value Added.
This 2nd metric is a solid measure of U.S supply. From 2000 at 6%, it rises inexorably to 18% in 2021.
That is over 3X expansion of profits inside our National Accounts.
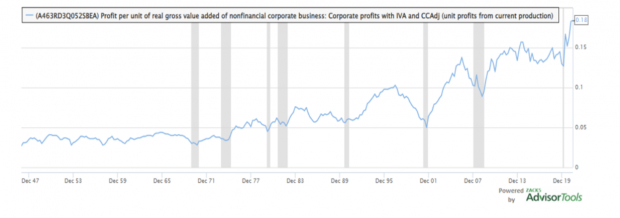 Image Source: Zacks Investment Research
No matter what is included or excluded, this is an unprecedented profit boom.
(4) A final factor to write you about is the boom that was built by U.S. corporations from earnings made abroad the last 2 decades.
These get accounted for separately, with National Accounts.
The next chart shows you: from 2000 and $100B, Rest-of-the-World Corporate Profits After Tax has gone up to $500B in 2021.
That’s a 5X increase!
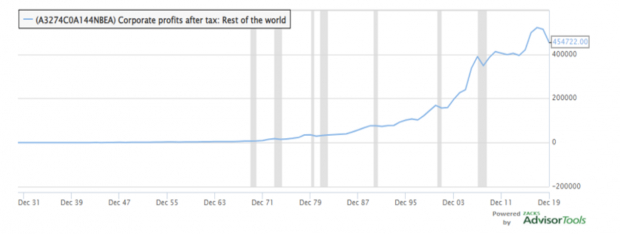 Image Source: Zacks Investment Research
Let’s use a $1.7T figure for 2021 Nonfinancial Corporate Business After Tax. That means $500B/$1,700B = 29.4%.
Roughly 30% more added U.S. Corporate Profits have flowed in from abroad.


Image: Bigstock
How to Size Up the U.S. Corporate Profit Boom?
This is an excerpt from our most recent Economic Outlook report. To access the full PDF, please click here.
Corporate profits have never been fatter — or accounted for a bigger portion of the overall U.S. economy.
One reason?
Companies were able to boost prices amid global supply chain shortages, leaving both U.S. and global consumers paying more for everything, from gasoline to food to toys. Corporate expenses haven't climbed as quickly, even as firms grapple with labor shortages and higher wages.
(1) Consider U.S. Corporate After-tax Profits in the National Accounts.
These recently made up about 11.7% of GDP, a measure experts typically use to gauge the nation's economic health. It's been nearly a decade since that proportion was even close, according to Bureau of Economic Analysis (BEA) figures.
This parallels the large-cap U.S. multi-national stock ticker story. According to Zacks Research Director Sheraz Mian’s latest data, Q4-2021 S&P500 quarterly net margins are coming in at 12.8%. The S&P500 Net Margin peaked at 13.4% in Q3-2021.
If you are looking for a very detailed comparison of these two profit data sets, the stock strategist Dr. Edward Yardeni puts out an updated 19-page booklet for you. Click the link to explore that: Corporate Finance Briefing: NIPA vs. S&P500 Profits
(2) Note this fascinating macro detail, too:
The little understood Inventory Valuation Adjustment (IVA) for 2021 was around $300B, inside U.S. GDP accounts in 2021 given the supply chain depletion.
This is typically a National Accounts adjustment which floats closer to $30B each year.
Why?
Supply chain depletions radically reduced U.S. corporate inventories, which were sold at a hefty profit during this pandemic.
Warehouses, restaurants, retail outfits, you name it — they all struggled mightily to stock inventory, given the Los Angeles-Long Beach port backups.
A second adjustment macro-economists typically make, didn’t make for much added change to corporate profits.
The Capital Consumption Adjustment (CCA) was around $50B in 2021, which is more or less consistent with a longer time series.
Here is how the U.S. Bureau of Economic Analysis (BEA) defines those 2 terms--
(A) Inventory Valuation Adjustment (IVA): An adjustment made in the national income and product accounts (NIPAs) to corporate profits and to proprietors' income in order to remove inventory "profits," which are more like a capital-gain than profits from current production.
(B) Capital Consumption Adjustment (CCAdj.): The difference between private capital consumption allowances (CCA) and private consumption of fixed capital (CFC).
CCA: Consists of tax-return-based depreciation charges for corporations and nonfarm proprietorships and of historical-cost depreciation (calculated by BEA) for farm proprietorships, rental income of persons and nonprofit institutions.
CFC: The charge for the using up of private and government fixed capital located in the United States. It is the decline in the value of the stock of fixed assets due to wear and tear, obsolescence, accidental damage and aging. For general government and for nonprofit institutions that primarily serve individuals, CFC serves as a measure of the value of the current services of the fixed assets owned and used by these entities.
The net of those arcane GDP subtractions made up for the difference in the two charts I presented to you.
(3) Another element of study to account for here?
Remove corporate banking profits from overall U.S. profit accounting.
Then, we can just focus on what is known as Nonfinancial Corporate Business Profits. Those are the actual producers inside the massive U.S. economy.
I show these metrics next.
The first chart shows absolute Nonfinancial Corporate Profits boom. It went vertical.
The second chart displays Profit per Unit of Real Gross Value Added.
This 2nd metric is a solid measure of U.S supply. From 2000 at 6%, it rises inexorably to 18% in 2021.
That is over 3X expansion of profits inside our National Accounts.
No matter what is included or excluded, this is an unprecedented profit boom.
(4) A final factor to write you about is the boom that was built by U.S. corporations from earnings made abroad the last 2 decades.
These get accounted for separately, with National Accounts.
The next chart shows you: from 2000 and $100B, Rest-of-the-World Corporate Profits After Tax has gone up to $500B in 2021.
That’s a 5X increase!
Let’s use a $1.7T figure for 2021 Nonfinancial Corporate Business After Tax. That means $500B/$1,700B = 29.4%.
Roughly 30% more added U.S. Corporate Profits have flowed in from abroad.