The US Money Supply has surged by over 50% in the last 3 years, marking the largest 3-year increase in history. The M2 Money Supply we can see below refers to the measure of money supply that includes financial assets held mainly by households such as savings deposits, time deposits, and balances in money market funds. It also includes the more readily-available liquid financial assets as defined by the M1 measure of money, such as currency, demand deposits, and other checkable deposits.
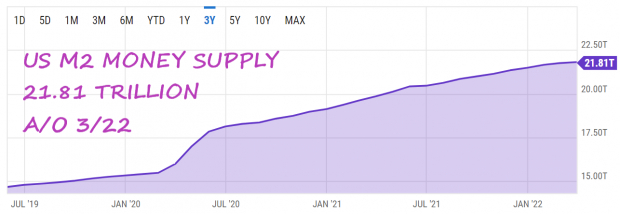
Image Source: YCharts
We are privileged to have many decades of market data to learn from, and it is this historical research and analysis that can help guide us in the current market environment. What can we learn from historical periods during which the Money Supply experienced similar substantial increases?
Two data points corresponding to 1973 and 1977-1978 were the only other times in which the Money Supply increased by greater than 40%. For those that know their market history, what do these years have in common?
Both were followed by recessions in the years after, along with bear markets and high inflation. It’s important to state that this doesn’t necessarily mean that a recession is coming. But we do know that the Nasdaq is in a bear market and we are in the midst of a 40-year high in inflation. The GDP print in the first quarter was negative, and earnings growth has slowed substantially versus last year.
The initial effects of money printing typically appear favorable as the economy booms from the added stimulus, with asset prices experiencing considerable increases. But over time, the expected effects of money printing begin to rear their ugly head. The Fed is then faced with two alternatives: continue printing, or unwind the balance sheet and raise interest rates.
The Fed has chosen the latter path, and rightfully so. This has translated into a strengthening of the dollar and lower asset prices. While this can be quite painful for stock investors in the short-term, any economist will tell you that in the long run this is by far the more prudent decision.
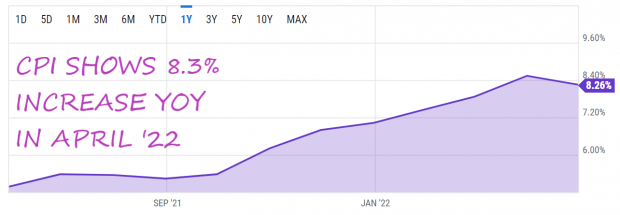
Image Source: YCharts
This morning we learned that the Consumer Price Index (CPI) increased 8.3% in April from a year ago, a slight softening from the 8.5% from March. The figure is still hovering near 40-year highs and remains the single biggest threat to a continued economic expansion. In this type of market environment, we want to stick with what’s been working this year as higher prices continue to benefit certain industries.
One such industry is the Zacks Oil and Gas – Integrated – United States group, which currently ranks in the top 11% out of approximately 250 industries. This group has soared more than 45% this year while the market has been in correction mode. Also note the favorable characteristics for this industry below:
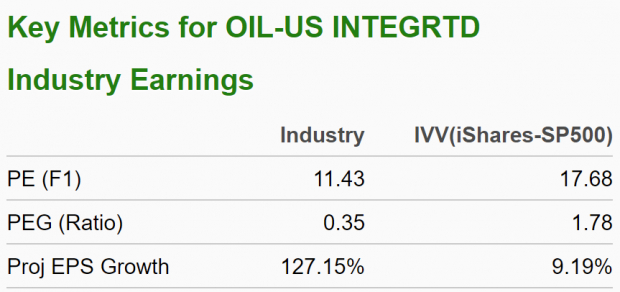
Image Source: Zacks Investment Research
By focusing on stocks within the top Zacks Ranked Industries, we can provide a constant ‘tailwind’ to our investing success. Let’s take a look at a Zacks Rank #1 (Strong Buy) stock within this leading industry.
Hess Corporation
Hess Corp. is an exploration and production company that develops, produces, transports, and sells crude oil and natural gas. HES operates primarily in the U.S., Guyana, Malaysia, and Canada. The company also provides water handling services in the Williston Basin area of North Dakota. Hess Corp. was incorporated in 1920 and is based in New York, NY.
HES has exceeded earnings estimates in three of the past four quarters, producing an average earnings beat of 12.7% over that timeframe. The commodity exploration company most recently reported Q1 EPS two weeks ago of $1.30, a 16.07% surprise over the $1.12 consensus estimate. The stock is up nearly 50% this year alone.
Hess Corporation Price, Consensus and EPS Surprise

Analysts have increased their full-year EPS estimates by 58.58% in the past 60 days. The Zacks Consensus Estimate now stands at $9.61, reflecting potential growth of 338.81% relative to last year.
Keep an eye on HES as well as its industry group during this difficult market period.


Image: Bigstock
The Repercussions of Money Printing: What to Do Now
The US Money Supply has surged by over 50% in the last 3 years, marking the largest 3-year increase in history. The M2 Money Supply we can see below refers to the measure of money supply that includes financial assets held mainly by households such as savings deposits, time deposits, and balances in money market funds. It also includes the more readily-available liquid financial assets as defined by the M1 measure of money, such as currency, demand deposits, and other checkable deposits.
Image Source: YCharts
We are privileged to have many decades of market data to learn from, and it is this historical research and analysis that can help guide us in the current market environment. What can we learn from historical periods during which the Money Supply experienced similar substantial increases?
Two data points corresponding to 1973 and 1977-1978 were the only other times in which the Money Supply increased by greater than 40%. For those that know their market history, what do these years have in common?
Both were followed by recessions in the years after, along with bear markets and high inflation. It’s important to state that this doesn’t necessarily mean that a recession is coming. But we do know that the Nasdaq is in a bear market and we are in the midst of a 40-year high in inflation. The GDP print in the first quarter was negative, and earnings growth has slowed substantially versus last year.
The initial effects of money printing typically appear favorable as the economy booms from the added stimulus, with asset prices experiencing considerable increases. But over time, the expected effects of money printing begin to rear their ugly head. The Fed is then faced with two alternatives: continue printing, or unwind the balance sheet and raise interest rates.
The Fed has chosen the latter path, and rightfully so. This has translated into a strengthening of the dollar and lower asset prices. While this can be quite painful for stock investors in the short-term, any economist will tell you that in the long run this is by far the more prudent decision.
Image Source: YCharts
This morning we learned that the Consumer Price Index (CPI) increased 8.3% in April from a year ago, a slight softening from the 8.5% from March. The figure is still hovering near 40-year highs and remains the single biggest threat to a continued economic expansion. In this type of market environment, we want to stick with what’s been working this year as higher prices continue to benefit certain industries.
One such industry is the Zacks Oil and Gas – Integrated – United States group, which currently ranks in the top 11% out of approximately 250 industries. This group has soared more than 45% this year while the market has been in correction mode. Also note the favorable characteristics for this industry below:
Image Source: Zacks Investment Research
By focusing on stocks within the top Zacks Ranked Industries, we can provide a constant ‘tailwind’ to our investing success. Let’s take a look at a Zacks Rank #1 (Strong Buy) stock within this leading industry.
Hess Corporation
Hess Corp. is an exploration and production company that develops, produces, transports, and sells crude oil and natural gas. HES operates primarily in the U.S., Guyana, Malaysia, and Canada. The company also provides water handling services in the Williston Basin area of North Dakota. Hess Corp. was incorporated in 1920 and is based in New York, NY.
HES has exceeded earnings estimates in three of the past four quarters, producing an average earnings beat of 12.7% over that timeframe. The commodity exploration company most recently reported Q1 EPS two weeks ago of $1.30, a 16.07% surprise over the $1.12 consensus estimate. The stock is up nearly 50% this year alone.
Hess Corporation Price, Consensus and EPS Surprise
Analysts have increased their full-year EPS estimates by 58.58% in the past 60 days. The Zacks Consensus Estimate now stands at $9.61, reflecting potential growth of 338.81% relative to last year.
Keep an eye on HES as well as its industry group during this difficult market period.