Note: The following is an excerpt from this week’s Earnings Trends report. You can access the full report that contains detailed historical actual and estimates for the current and following periods, please click here>>>
Here are the key points:
- The trend of negative estimate revisions that had reemerged over the last few quarters — after reversing course earlier in the pandemic — has further accelerated ahead of the start of the 2022 Q4 earnings season, with estimates for the current and coming periods significantly coming down.
- For 2022 Q4, aggregate S&P 500 earnings are now expected to be down -6.5% on +4.2% higher revenues. The -6.5% decline in index earnings today is down from +1.7% on October 5th.
- Excluding the Energy sector’s strong contribution from the S&P 500 index, Q4 earnings for the rest of the index are expected to be down -10.8% on +3.2% higher revenues. The -10.8% decline in index earnings today is down from -2.9% on October 5th.
- Q4 earnings estimates have come down for 13 of the 16 Zacks sectors since the quarter got underway, with Transportation and Autos enjoying modest positive revisions and Aerospace estimates essentially flat.
- In terms of the magnitude of estimate cuts, the Basic Materials and Consumer Discretionary sectors have suffered the most, followed by Construction, Technology and the Retail sectors. Even Energy sector estimates have come down since the quarter got underway.
- Full-year 2023 earnings estimates have been coming down after peaking in mid-April, with the aggregate total down -9.2% from the peak for the index as a whole and -11.9% excluding the Energy sector’s contribution.
- Since the mid-April peak, aggregate 2023 earnings estimates have declined for 13 of the 16 Zacks sectors, with the biggest declines in the Construction (down -27.1% in absolute terms), Consumer Discretionary (-20.7%), Retail (-20.4%), Technology (-19.4%), Basic Materials (-15.4%), Industrial Products (-13.9%), Aerospace (-13.4%) and Transportation (-9.3%).
- We strongly dispute the notion that earnings estimates remain out of sync with the economic ground reality, particularly if the economic slowdown resulting from the Fed’s extraordinary tightening turns out to be moderate.
- Looking at the calendar-year picture, total S&P 500 earnings are expected to be up +4.6% in 2022 and +2.5% in 2023. On an ex-Energy basis, total 2022 index earnings would be down -2.2% (instead of +4.6%, with Energy).
- The implied ‘EPS’ for the S&P 500 index, calculated using the current 2022 P/E of 18.4X; and index close as of December 14th is $217.36, up from $207.74 in 2021.
- Using the same methodology, the index ‘EPS’ works out to $223.73 for 2023 (P/E of 17.9X) and $241.20 in 2024 (P/E of 16.6X). The multiples have been calculated using the index’s total market cap and aggregate bottom-up earnings for each year.
The overall picture that emerged out of Q3 earnings season was one of stability and resilience, even as the negative revisions trend accelerated.
Earnings weren’t great, but they weren’t bad either. Many in the market feared an earnings cliff that would force management teams across many industries to provide downbeat guidance.
Not much growth was expected given where we are in the economic cycle. But the actual growth coming through the results was ever so slightly better than expected. It is this performance relative to expectations rather than the absolute level of earnings or the growth pace that is of relevance to the market.
Expectations for 2022 Q4 and beyond have been reset lower, as we have been pointing out for a while now. Analysts have been steadily cutting their estimates, reversing the positive revisions trend that we witnessed during the Covid quarters.
We saw this in the run up to the start of the Q3 earnings season, and the trend continues with respect to estimates for the current period (2022 Q4) and full-year 2023.
The charts below show how earnings growth expectations for the 2022 Q4, as a whole and on an ex-Energy basis, have since the quarter got underway:
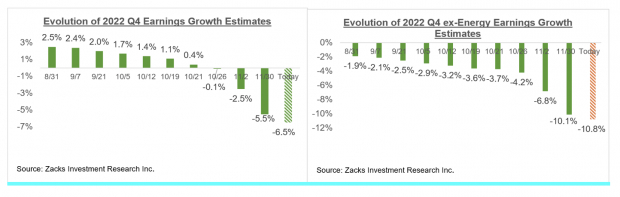
Image Source: Zacks Investment Research
The chart below shows how the expected aggregate total earnings for full-year 2023 have evolved on an ex-Energy basis:
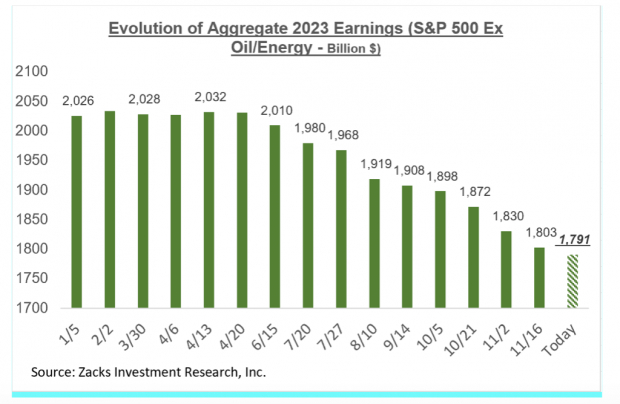
Image Source: Zacks Investment Research
As we have consistently been pointing out, aggregate S&P 500 earnings outside of the Energy sector peaked in mid-April and have been steadily trending down ever since.
The Overall Earnings Picture
The chart below that provides a big-picture view of earnings on a quarterly basis. The growth rate for Q4 is on a blended basis, where the actual reports that have come out are combined with estimates for the still-to-come companies.
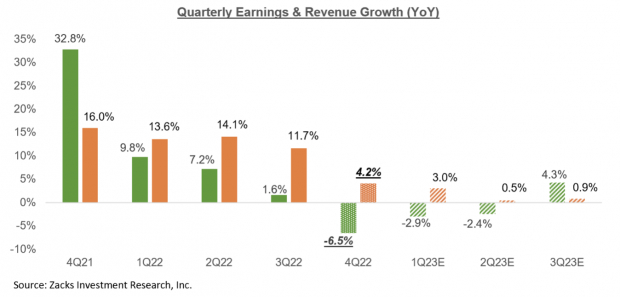
Image Source: Zacks Investment Research
The chart below shows the overall earnings picture on an annual basis, with the growth momentum expected to continue:
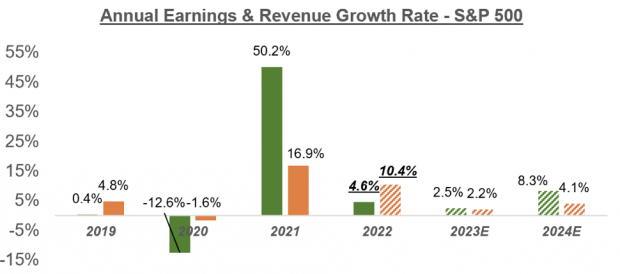
Image Source: Zacks Investment Research
As you can see, earnings next year are expected to be up only +2.5%. This magnitude of growth can hardly be called out-of-sync with a flat or even modestly down economic growth outlook. Don’t forget that headline GDP growth numbers are in real or inflation-adjusted terms while S&P 500 earnings discussed here are not.
As mentioned earlier, 2023 aggregate earnings estimates on an ex-Energy basis are already down by more than -11% since mid-April. Perhaps we see a bit more downward adjustments to estimates over the coming weeks, after the Q4 reporting cycle really gets underway. But we have nevertheless already covered some ground in taking estimates to a fair, appropriate level.
This is particularly so if whatever economic downturn lies ahead proves to be more of the "garden variety” than the last two such events. Recency bias forces us to use the last two economic downturns, which were also among the nastiest in recent history, as our reference points. But we need to be cautious against that natural tendency as the economy’s foundations at present remain unusually strong.


Image: Bigstock
Have Earnings Estimates Come Down Enough?
Note: The following is an excerpt from this week’s Earnings Trends report. You can access the full report that contains detailed historical actual and estimates for the current and following periods, please click here>>>
Here are the key points:
The overall picture that emerged out of Q3 earnings season was one of stability and resilience, even as the negative revisions trend accelerated.
Earnings weren’t great, but they weren’t bad either. Many in the market feared an earnings cliff that would force management teams across many industries to provide downbeat guidance.
Not much growth was expected given where we are in the economic cycle. But the actual growth coming through the results was ever so slightly better than expected. It is this performance relative to expectations rather than the absolute level of earnings or the growth pace that is of relevance to the market.
Expectations for 2022 Q4 and beyond have been reset lower, as we have been pointing out for a while now. Analysts have been steadily cutting their estimates, reversing the positive revisions trend that we witnessed during the Covid quarters.
We saw this in the run up to the start of the Q3 earnings season, and the trend continues with respect to estimates for the current period (2022 Q4) and full-year 2023.
The charts below show how earnings growth expectations for the 2022 Q4, as a whole and on an ex-Energy basis, have since the quarter got underway:
Image Source: Zacks Investment Research
The chart below shows how the expected aggregate total earnings for full-year 2023 have evolved on an ex-Energy basis:
Image Source: Zacks Investment Research
As we have consistently been pointing out, aggregate S&P 500 earnings outside of the Energy sector peaked in mid-April and have been steadily trending down ever since.
The Overall Earnings Picture
The chart below that provides a big-picture view of earnings on a quarterly basis. The growth rate for Q4 is on a blended basis, where the actual reports that have come out are combined with estimates for the still-to-come companies.
Image Source: Zacks Investment Research
The chart below shows the overall earnings picture on an annual basis, with the growth momentum expected to continue:
Image Source: Zacks Investment Research
As you can see, earnings next year are expected to be up only +2.5%. This magnitude of growth can hardly be called out-of-sync with a flat or even modestly down economic growth outlook. Don’t forget that headline GDP growth numbers are in real or inflation-adjusted terms while S&P 500 earnings discussed here are not.
As mentioned earlier, 2023 aggregate earnings estimates on an ex-Energy basis are already down by more than -11% since mid-April. Perhaps we see a bit more downward adjustments to estimates over the coming weeks, after the Q4 reporting cycle really gets underway. But we have nevertheless already covered some ground in taking estimates to a fair, appropriate level.
This is particularly so if whatever economic downturn lies ahead proves to be more of the "garden variety” than the last two such events. Recency bias forces us to use the last two economic downturns, which were also among the nastiest in recent history, as our reference points. But we need to be cautious against that natural tendency as the economy’s foundations at present remain unusually strong.