This is an excerpt from our most recent Economic Outlook report. To access the full PDF, please click here.
I posed a key question as a title for this week’s key topic:
Has this post-COVID U.S. economy been expanding, stayed static, or did it contract this year?
Of course, there is a critical second follow-on topic: Will this trend continue into next year?
To answer these two cornerstone questions formally, I employ a very helpful set of weekly Fed of St. Louis (FRED) macro data.
You may not know about this novel time series. It shows solid expansion, to the end of Q3-2023.
That expansion is going to be an assist — to Q3 earnings and revenue reports — due shortly.
I. The U.S. Weekly Economic Index (WEI)
Quarterly GDP growth data gets quite stale. Since it takes the U.S. government’s Bureau of Economic Analysis (BEA) three attempts to construct a final GDP growth data set.
These old quarterly numbers share no forward-looking value.
There is a remedy to that. One you likely don’t know about.
A. The WEI is an index of real U.S. economic activity — using timely, relevant high-frequency data.
It represents the common component of ten different daily and weekly series, covering consumer behavior, the labor market and production.
The WEI is then scaled to the four-quarter GDP growth rate.
For example, if the WEI reads minus -2.0% and the current level of the WEI persists for an entire quarter, one would expect, on average, the level of U.S. GDP growth that quarter to be minus 2 percent lower than a year previously.
Using the chart below, first note the WEI has been trending higher since a May 13th, 2023 low at +0.74%. Growth matters were indeed week in the U.S. economy in late Spring of 2023, with the Tech layoffs.
Second, note this. Through the Oct. 5th, 2023 date, the WEI came in at +1.83%. So, one would expect, on average GDP growth in Q3-23 to be roughly +2.0% higher than a year prior.
That is a U.S. economy that is softly warming up in the Fall of 2023.
Weekly Economic Index (Lewis-Mertens-Stock)
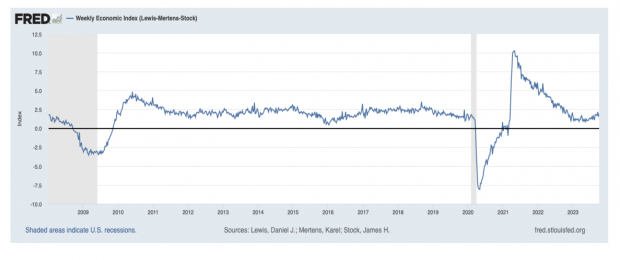
Image Source: St Louis Federal Reserve
The WEI is a composite of 10 weekly economic indicators:
- Redbook same-store sales
- Rasmussen Consumer Index
- New claims for unemployment insurance
- Continued claims for unemployment insurance
- Adjusted income/employment tax withholdings (from Booth Financial Consulting)
- Railroad traffic originated (from the Association of American Railroads)
- The American Staffing Association Staffing Index
- Steel production
- Wholesale sales of gasoline, diesel, and jet fuel, and
- Weekly average U.S. electricity load (with remaining data supplied by Haver Analytics)
All series are represented as year-over-year percentage changes. These series are combined into a single index of weekly economic activity.
For additional details, including an analysis of the performance of the model, see Lewis, Mertens, and Stock (2020), “U.S. Economic Activity during the Early Weeks of the SARS-Cov-2 Outbreak."
This index has been developed by Daniel Lewis, an economist in the Federal Reserve Bank of New York, Karel Mertens, a senior economic policy advisor at the Federal Reserve Bank of Dallas, and James Stock, the Harold Hitchings Burbank Professor of Political Economy, Faculty of Arts and Sciences of Harvard University.
The index is not an official forecast of the Federal Reserve Bank of New York, its president, the Federal Reserve System, or the Federal Open Market Committee.
B. Corroborating the WEI to Current U.S. Labor Market Circumstances
One would need to see the U.S. services sector hours worked to be falling, if the U.S. was indeed cooling.
That is NOT what is happening, at the moment, in the chart below.
Average Weekly Hours of All Employees, Professional and Business Services
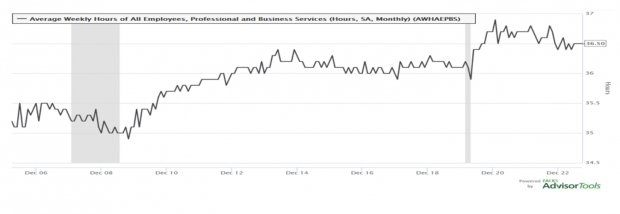
Image Source: St Louis Federal Reserve
What can you note about hours worked, in this U.S. services data series?
This major U.S. services group marks their weekly work effort at 36.5 hours, now, versus ~ 36 hours prior to COVID. That shows a slightly stronger work effort, in line with the soft GDP growth showing up in the WEI data.
Next, let’s inspect the U.S. unemployment claims trend, for corroborating evidence of soft warming.
Within the WEI, this data is embedded. This is a broader net, the 4-week moving average of U.S. continuing insured unemployment claims.
This data hit a recent high in late April 2023 at 1.83M. It has declined since then to 1.67M. That is a welcome fall of -160K; not a huge claims decline, but a decline nonetheless.
This is a U.S. unemployment claims data trend --consistent with a steadily warming growth trend in the underlying U.S. economy—like one that was picked up by the WEI.


Image: Bigstock
Is the U.S. Economy Warming Up or Cooling Down?
This is an excerpt from our most recent Economic Outlook report. To access the full PDF, please click here.
I posed a key question as a title for this week’s key topic:
Has this post-COVID U.S. economy been expanding, stayed static, or did it contract this year?
Of course, there is a critical second follow-on topic: Will this trend continue into next year?
To answer these two cornerstone questions formally, I employ a very helpful set of weekly Fed of St. Louis (FRED) macro data.
You may not know about this novel time series. It shows solid expansion, to the end of Q3-2023.
That expansion is going to be an assist — to Q3 earnings and revenue reports — due shortly.
I. The U.S. Weekly Economic Index (WEI)
Quarterly GDP growth data gets quite stale. Since it takes the U.S. government’s Bureau of Economic Analysis (BEA) three attempts to construct a final GDP growth data set.
These old quarterly numbers share no forward-looking value.
There is a remedy to that. One you likely don’t know about.
A. The WEI is an index of real U.S. economic activity — using timely, relevant high-frequency data.
It represents the common component of ten different daily and weekly series, covering consumer behavior, the labor market and production.
The WEI is then scaled to the four-quarter GDP growth rate.
For example, if the WEI reads minus -2.0% and the current level of the WEI persists for an entire quarter, one would expect, on average, the level of U.S. GDP growth that quarter to be minus 2 percent lower than a year previously.
Using the chart below, first note the WEI has been trending higher since a May 13th, 2023 low at +0.74%. Growth matters were indeed week in the U.S. economy in late Spring of 2023, with the Tech layoffs.
Second, note this. Through the Oct. 5th, 2023 date, the WEI came in at +1.83%. So, one would expect, on average GDP growth in Q3-23 to be roughly +2.0% higher than a year prior.
That is a U.S. economy that is softly warming up in the Fall of 2023.
Weekly Economic Index (Lewis-Mertens-Stock)
Image Source: St Louis Federal Reserve
The WEI is a composite of 10 weekly economic indicators:
All series are represented as year-over-year percentage changes. These series are combined into a single index of weekly economic activity.
For additional details, including an analysis of the performance of the model, see Lewis, Mertens, and Stock (2020), “U.S. Economic Activity during the Early Weeks of the SARS-Cov-2 Outbreak."
This index has been developed by Daniel Lewis, an economist in the Federal Reserve Bank of New York, Karel Mertens, a senior economic policy advisor at the Federal Reserve Bank of Dallas, and James Stock, the Harold Hitchings Burbank Professor of Political Economy, Faculty of Arts and Sciences of Harvard University.
The index is not an official forecast of the Federal Reserve Bank of New York, its president, the Federal Reserve System, or the Federal Open Market Committee.
B. Corroborating the WEI to Current U.S. Labor Market Circumstances
One would need to see the U.S. services sector hours worked to be falling, if the U.S. was indeed cooling.
That is NOT what is happening, at the moment, in the chart below.
Average Weekly Hours of All Employees, Professional and Business Services
Image Source: St Louis Federal Reserve
What can you note about hours worked, in this U.S. services data series?
This major U.S. services group marks their weekly work effort at 36.5 hours, now, versus ~ 36 hours prior to COVID. That shows a slightly stronger work effort, in line with the soft GDP growth showing up in the WEI data.
Next, let’s inspect the U.S. unemployment claims trend, for corroborating evidence of soft warming.
Within the WEI, this data is embedded. This is a broader net, the 4-week moving average of U.S. continuing insured unemployment claims.
This data hit a recent high in late April 2023 at 1.83M. It has declined since then to 1.67M. That is a welcome fall of -160K; not a huge claims decline, but a decline nonetheless.
This is a U.S. unemployment claims data trend --consistent with a steadily warming growth trend in the underlying U.S. economy—like one that was picked up by the WEI.