This is an excerpt from our most recent Economic Outlook report. To access the full PDF, please click here.
It’s time to review the U.S. Consumer Price Inflation (CPI) landscape.
In this piece, I explore six U.S. inflation measures, using Percent Change from a Year Ago.
We do a look-back over the last year’s progress. In order to evaluate the progress made, in restraining Consumer Price Inflation.
Stable prices (hovering around +2.0% annually) is a statutory target, undertaken by the U.S. Fed.
I. The Personal Consumption Expenditures (PCE) Price Index is a measure of the prices that people living in the United States, or those buying on their behalf, pay for goods and services.
The change in the PCE price index is known for capturing inflation (or deflation) across a wide range of consumer expenses and reflecting changes in consumer behavior. For example, if car prices rise, car sales may decline while bicycle sales increase.
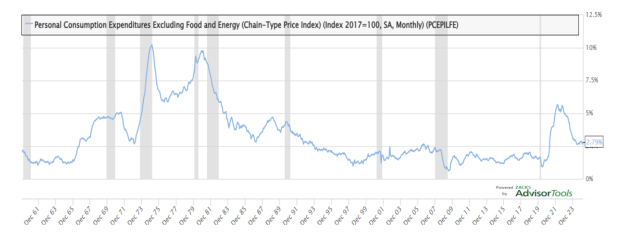
Image Source: Zacks Investment Research
The PCE Price Index is produced by the Bureau of Economic Analysis (BEA), which revises previously published PCE data to reflect updated information or new methodology, providing consistency across decades of data that's valuable for researchers.
They also offer the series as a Chain-Type index and excluding food and energy products, as above. The PCE price index less food excluding food and energy is used primarily for macroeconomic analysis and forecasting future values of the PCE price index.
- The PCE Price Index is similar to the Bureau of Labor Statistics' consumer price index for urban consumers (CPI-U)
- The two indexes, which have their own Federal government purposes and uses, are constructed differently, resulting in different inflation rates
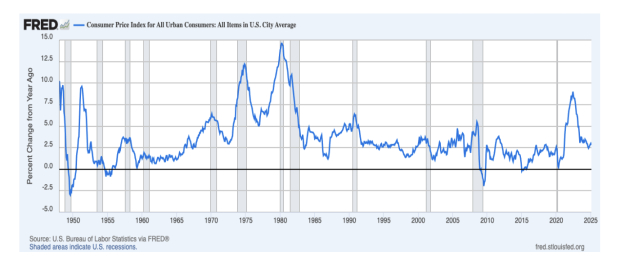
Image Source: Zacks Investment Research
Progress?
(1) In Q4-24, the core PCE index was rising +2.6% y/y.
(2) In Feb. 2024, the CPI – All Urban Consumers was +3.17%. In Feb. 2025, it was +2.81% y/y.
The primary sticky price struggle is arriving from the sub-index (Rent of Primary Residence). This was rising +4.1% y/y in Feb. 2025.
Consult that data below:
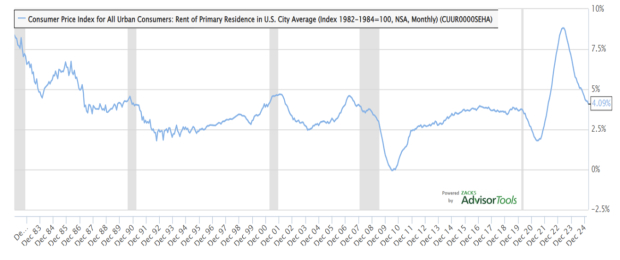
Image Source: Zacks Investment Research
II. The Trimmed Mean PCE inflation Rate produced by the Federal Reserve Bank of Dallas is an alternative measure of core inflation in the price index for personal consumption expenditures (PCE).
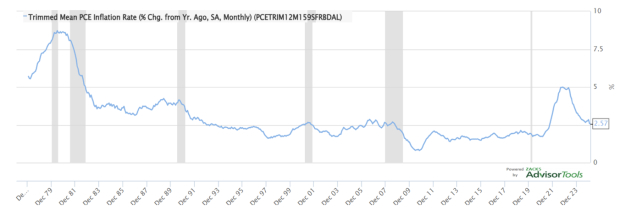
Image Source: Zacks Investment Research
The data series is calculated by the Dallas Fed, using data from the Bureau of Economic Analysis (BEA). Calculating the trimmed mean PCE inflation rate for a given month involves looking at the price changes for each of the individual components of personal consumption expenditures.
The individual price changes are sorted in ascending order from “fell the most” to “rose the most,” and a certain fraction of the most extreme observations at both ends of the spectrum are thrown out or trimmed. The inflation rate is then calculated as a weighted average of the remaining components.
The trimmed mean inflation rate is a proxy for true core PCE inflation rate.
The resulting inflation measure has been shown to outperform the more conventional “excluding food and energy” measure as a gauge of core inflation.
Progress?
In Feb. 2024, Trimmed Mean PCE Inflation was +3.13% y/y. In Feb. 2025, it was +2.57% y/y.
Image: Bigstock
Sizing Up 2025 U.S. Inflation
This is an excerpt from our most recent Economic Outlook report. To access the full PDF, please click here.
It’s time to review the U.S. Consumer Price Inflation (CPI) landscape.
In this piece, I explore six U.S. inflation measures, using Percent Change from a Year Ago.
We do a look-back over the last year’s progress. In order to evaluate the progress made, in restraining Consumer Price Inflation.
Stable prices (hovering around +2.0% annually) is a statutory target, undertaken by the U.S. Fed.
I. The Personal Consumption Expenditures (PCE) Price Index is a measure of the prices that people living in the United States, or those buying on their behalf, pay for goods and services.
The change in the PCE price index is known for capturing inflation (or deflation) across a wide range of consumer expenses and reflecting changes in consumer behavior. For example, if car prices rise, car sales may decline while bicycle sales increase.
Image Source: Zacks Investment Research
The PCE Price Index is produced by the Bureau of Economic Analysis (BEA), which revises previously published PCE data to reflect updated information or new methodology, providing consistency across decades of data that's valuable for researchers.
They also offer the series as a Chain-Type index and excluding food and energy products, as above. The PCE price index less food excluding food and energy is used primarily for macroeconomic analysis and forecasting future values of the PCE price index.
Image Source: Zacks Investment Research
Progress?
(1) In Q4-24, the core PCE index was rising +2.6% y/y.
(2) In Feb. 2024, the CPI – All Urban Consumers was +3.17%. In Feb. 2025, it was +2.81% y/y.
The primary sticky price struggle is arriving from the sub-index (Rent of Primary Residence). This was rising +4.1% y/y in Feb. 2025.
Consult that data below:
Image Source: Zacks Investment Research
II. The Trimmed Mean PCE inflation Rate produced by the Federal Reserve Bank of Dallas is an alternative measure of core inflation in the price index for personal consumption expenditures (PCE).
Image Source: Zacks Investment Research
The data series is calculated by the Dallas Fed, using data from the Bureau of Economic Analysis (BEA). Calculating the trimmed mean PCE inflation rate for a given month involves looking at the price changes for each of the individual components of personal consumption expenditures.
The individual price changes are sorted in ascending order from “fell the most” to “rose the most,” and a certain fraction of the most extreme observations at both ends of the spectrum are thrown out or trimmed. The inflation rate is then calculated as a weighted average of the remaining components.
The trimmed mean inflation rate is a proxy for true core PCE inflation rate.
The resulting inflation measure has been shown to outperform the more conventional “excluding food and energy” measure as a gauge of core inflation.
Progress?
In Feb. 2024, Trimmed Mean PCE Inflation was +3.13% y/y. In Feb. 2025, it was +2.57% y/y.