
Image: Bigstock
Best Stocks to Buy Now for November 2025
5 Best Stocks to Buy Today
| Company (Ticker) | 12 Week Price Change | Forward PE | Price | Proj EPS Growth (1 Year) | Projected Sales Growth (1Y) |
|---|---|---|---|---|---|
| Sandisk Corporation (SNDK) | 332.55% | 18.61 | $226.96 | 307.96% | 39.89% |
| Robinhood Markets (HOOD) | 10.52% | 59.01 | $114.97 | 78.74% | 51.19% |
| Southern Copper (SCCO) | 31.96% | 24.62 | $126.80 | 18.94% | 13.67% |
| Q2 Holdings (QTWO) | -10.06% | 30.11 | $70.81 | 42.55% | 13.60% |
| ePlus (PLUS) | 25.60% | 18.92 | $90.90 | 2.89% | 12.11% |
*Updated on November 25, 2025.
Sandisk Corporation (SNDK)
$226.96 USD +26.69 (13.33%)
3-Year Stock Price Performance
Premium Research for SNDK
- Zacks Rank
 Strong Buy 1
- Style Scores
D Value B Growth A Momentum B VGM
- Market Cap:$29.35B (Large Cap)
- Projected EPS Growth:308.03%
- Last Quarter EPS Growth:4,400.00%
- Last EPS Surprise:37.08%
- Next EPS Report date:NA
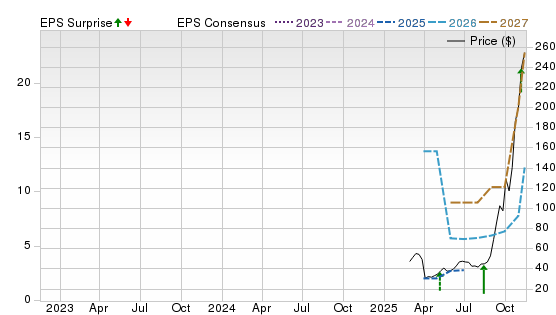
Our Take:
SanDisk develops NAND flash memory and storage solutions spanning client SSDs, removable cards, and enterprise flash. A 2025 spinoff from Western Digital refocused the franchise on core flash technology and capacity adds, while management outlines a path to lower unit costs as new fabs ramp.
A Zacks Rank #1 (Strong Buy) reflects upward earnings revisions, while its Style Scores of D for Value, B for Growth, and A for Momentum suggest estimate strength and price leadership even if traditional valuation looks rich.
The Price, Consensus & EPS Surprise chart shows a decisive price uptrend alongside rising 2026–2027 EPS lines, a classic estimate-momentum confirmation. The recent wobble is likely tied to near-term fab start-up costs pressuring margins, but guidance implies those headwinds ease through the year as utilization improves. For investors seeking exposure to a tightening flash cycle with operating leverage, SNDK offers a clean, pure-play setup after the separation.
Robinhood Markets (HOOD)
$114.97 USD +7.67 (7.15%)
3-Year Stock Price Performance
Premium Research for HOOD
- Zacks Rank
- Strong Buy 1
- Style Scores
F Value B Growth A Momentum C VGM
- Market Cap:$96.48B (Large Cap)
- Projected EPS Growth: 78.90%
- Last Quarter EPS Growth:45.24%
- Last EPS Surprise:19.61%
- Next EPS Report date:Feb. 11, 2026
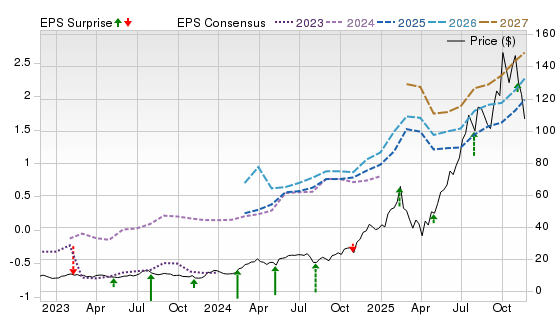
Our Take:
Robinhood operates a low-cost brokerage and crypto platform expanding into retirement, credit, and international markets. Management broadened the franchise with the Gold credit card and the Bitstamp acquisition, expanding crypto breadth and institutional reach across licensed jurisdictions. Its results have been backed by higher trading activity, net interest income, and a larger crypto presence.
A Zacks Rank #1 indicates positive estimate revisions. With F for Value, B for Growth, and A for Momentum, the Style Scores signal a growth-and-price-trend story rather than a value play. For tactical buyers, that combination often tracks improving fundamentals and persistent relative strength.
The chart depicts volatile but improving estimates, with 2027 nudging higher as profitability broadens. Near-term, sensitivity to crypto volumes and regulatory outcomes remains a risk, yet recent earnings upside and index inclusion underscore traction and liquidity support. Together, these factors frame HOOD as a momentum-tilted way to play the retail-trading and crypto cycle with expanding optionality.
Southern Copper (SCCO)
$126.80 USD +3.11 (2.51%)
3-Year Stock Price Performance
Premium Research for SCCO
- Zacks Rank
- Strong Buy 1
- Style Scores
D Value C Growth C Momentum D VGM
- Market Cap: $100.46B
- Projected EPS Growth: 18.94%
- Last Quarter EPS Growth:10.66%
- Last EPS Surprise:8.00%
- Next EPS Report date:Feb. 11, 2026
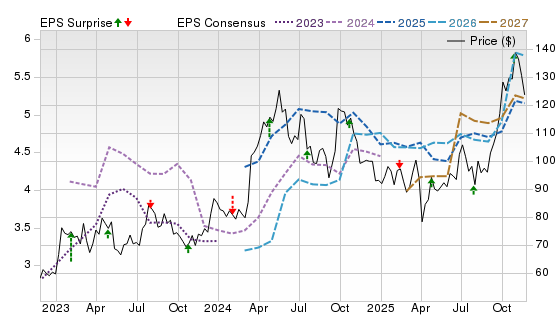
Our Take:
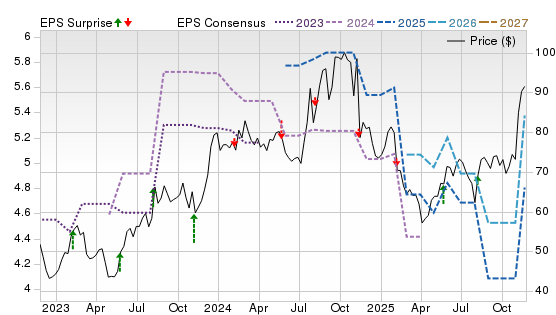
Southern Copper is a vertically integrated copper producer with large, long-life reserves across Peru and Mexico. The investment case is tied to tight copper fundamentals and SCCO’s multi-year project slate. Management highlights a market deficit and low inventories, while advancing the Tía María project toward a targeted 2027 start. The company continues to return cash via sizable quarterly dividends. Energy-transition demand and constrained new supply underpin a supportive medium-term setup.
A Zacks Rank #1 signals improving earnings expectations. Style Scores of D for Value, C for Growth, and B for Momentum suggest the appeal is cyclically driven, benefiting from copper’s structural demand (electrification/AI datacenters) and project execution rather than pure valuation.
The chart shows price consolidating while forward consensus stabilizes to slightly higher into 2026–2027, a constructive setup if copper prices remain firm and project execution stays on track.
Q2 Holdings (QTWO)
$70.81 USD -1.19 (-1.65%)
3-Year Stock Price Performance
Premium Research for QTWO
- Zacks Rank
- Strong Buy 1
- Style Scores
F Value A Growth D Momentum D VGM
- Market Cap:$4.50B (Mid Cap)
- Projected EPS Growth: 42.42%
- Last Quarter EPS Growth: 25.00%
- Last EPS Surprise:3.64%
- Next EPS Report date: Feb. 11, 2026
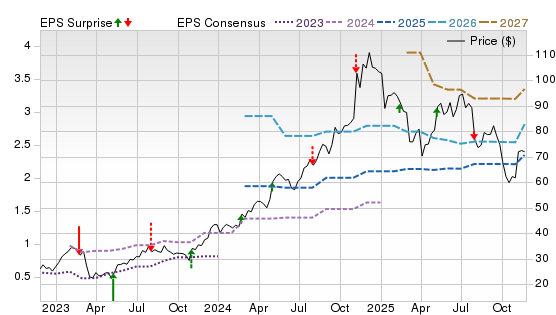
Our Take:
Q2 provides cloud software that powers digital banking for regional banks, credit unions, and fintechs. Its recent results highlight accelerating subscription momentum, expanding profitability, record backlog, and multiple Enterprise/Tier 1 wins across retail, commercial, and risk suites, leading management to raise its full-year outlook and authorize a $150 million buyback, reinforcing confidence in durable growth and cash generation.
The stock’s Zacks Rank #1 reflects upward estimate revisions, while Style Scores of F for Value, A for Growth, and D for Momentum indicate strong growth metrics and improving earnings momentum despite weaker value and near-term technical.
Its chart shows the share price breaking to highs as 2025–2027 consensus trends up, a constructive alignment typical of durable SaaS turns. Risks include bank tech budgets and execution in newer offerings, but improving profitability and rising attach rates strengthen visibility. For investors seeking a cleaner growth inflection in fintech infrastructure, QTWO’s setup remains attractive.
ePlus (PLUS)
$90.90 USD -0.61 (-0.67%)
3-Year Stock Price Performance
Premium Research for PLUS
- Zacks Rank
- Strong Buy 1
- Style Scores
C Value F Growth B Momentum F VGM
- Market Cap:$2.42B (Mid Cap)
- Projected EPS Growth:3.00%
- Last Quarter EPS Growth: 40.78%
- Last EPS Surprise: 61.05%
- Next EPS Report date:Feb. 4, 2026
Our Take:
ePlus is an IT solutions provider specializing in security, cloud, networking, and data center projects, serving both enterprise and public-sector clients. Management is benefiting from AI-driven infrastructure upgrades and a shift toward higher-margin services, with recent results showing double-digit gains in sales, EPS, and services revenue, and raised guidance. Partnerships across leading OEM ecosystems, including NVIDIA-aligned architectures via Cisco, position ePlus to capture enterprise AI and data-center spend while sustaining margin mix.
A Zacks Rank #1 indicates favorable estimate revisions. With a C for Value, F for Growth, and B for Momentum, the Style Scores highlight near-term price strength despite mixed growth optics as services scale.
The chart shows shares pushing to new highs as 2026–2027 estimates tick up, consistent with integration benefits and expanding managed offerings, which is a constructive signal that the market is discounting steadier, services-led earnings.
Best Stocks to Buy Now: How to Use This List
It’s important to understand what this list is, and what it isn’t.
For decades, the Zacks Rank has been a proven system that has helped investors identify stocks most likely to outperform. Instead of relying on hunches or hype, it’s grounded in earnings estimate revisions — a factor strongly correlated with stock price movement. When combined with additional fundamental metrics, the approach becomes even more powerful.
Still, it’s important to understand these basics:
- While the list offers exposure across several industries, it is not a fully diversified portfolio. You should think of it as a starting point, not a complete investing strategy.
- Even though these stocks are backed by a proven system, nothing protects you from short-term downside. Depending on market conditions, most — or even all — could decline in the near term.
- The Zacks Rank works because it captures trends in earnings momentum. That power plays out over weeks and months, not days. Investors with patience and discipline are more likely to benefit.
- Before buying any single stock, check how it aligns with your goals, risk tolerance, and broader portfolio.
Methodology
The Zacks Rank is a proprietary stock-rating model that uses trends in earnings estimate revisions and earnings-per-share (EPS) surprises to classify stocks into five groups: #1 (Strong Buy), #2 (Buy), #3 (Hold), #4 (Sell) and #5 (Strong Sell). The Zacks Rank is calculated through four primary factors related to earnings estimates: analysts' consensus on earnings estimate revisions, the magnitude of revision change, the upside potential and estimate surprise (or the degree in which earnings per share deviated from the previous quarter).
Zacks builds the data from 3,000 analysts at over 150 different brokerage firms. The average yearly gain for Zacks Rank #1 (Strong Buy) stocks is +23.62% per year from January, 1988, through June 2, 2025.
For this list, only companies in the top 50% of industries that have average daily trading volumes of 100,000 shares or more were considered. Stocks with a share value of $5 or less were excluded. These companies earned Zacks Rank #1 (Strong Buy) between Nov. 10 and Nov. 22, 2025. All information is current as of market open, Nov. 24, 2025.
Common Questions of New Investors
Where to Buy Stocks
To invest in stocks, you must open a brokerage account, fund the account and purchase stocks through your selected brokerage. Investors may also purchase stocks through a financial advisor or an automated robo advisor. Some publicly traded companies also offer a direct stock purchase plan, where you can purchase shares directly from the company.
Alternative Ways to Invest in Stocks
You can also invest in stock funds, such as mutual funds, index funds and exchange-traded funds, where the fund managers select the pool of stocks that follow an investing strategy. These funds may broadly cover an entire index, such as the S&P 500, or specific types of stocks, such as industries like technology and energy companies, company size such as small cap companies, or location like international companies.
How to Start Investing in Stocks Today
It’s easy to start investing by opening an online brokerage account. Opening a standard brokerage account takes about 20 minutes and you’ll need to have some personal information ready, such as your social security number and your bank details to fund your account.
You’ll need to decide whether to open a taxable account (most common), a tax-deferred retirement account such as a traditional IRA or a tax-free retirement account such as a Roth IRA, which is funded with after-tax dollars, but qualified withdrawals are tax-free. A margin account allows for borrowing to purchase stocks and is best for experienced traders.
Set goals before you begin investing – determine how much you can afford to invest and your tolerance for risk.
What to Look for When You Buy Stocks?
The goal in all equities investment is to buy low and sell high, growing your wealth over time. Researching the companies to invest in is key – what kind of product or service do they offer? How do they compare with competitors? How fast are they growing? Does the stock pay regular dividends to shareholders? Does the stock help diversify your portfolio by giving you exposure to a market segment you currently don’t hold?
Understanding fundamental analysis can help determine whether the stock has the potential for growth at its current purchase price. Factors that can help determine that include earnings per share (EPS), price-to-earnings ratio and PE growth. Technical analysis is used looking at statistical patterns to potentially predict future price moves. Some investors may look for a growth and income strategy, looking for stocks with solid revenues that pay good dividends, or a value strategy, looking if a current stock price is below what their revenue, EPS and other factors suggest.
Analysts also often look for the momentum of a stock by looking at moving averages of a stock's closing price over a 50-day, 100-day or 12-month trailing time period to determine signals whether to buy or sell a stock.

 Hits New 52-Week High")


 Stocks to Buy Now November 2025")

