5 Best Dividend Stocks to Buy Today
| Company (Ticker) | 12 Week Price Change | Annual Dividend | Annualized Dividend Growth | Dividend Payout Ratio | Dividend Yield |
|---|---|---|---|---|---|
| Columbia Banking System (COLB) | 10.02% | $1.44 | 7.05% | 51.00% | 5.53% |
| Prudential Financial (PRU) | 2.39% | $5.40 | 4.17% | 41.00% | 5.24% |
| Euroseas (ESEA) | 13.90% | $2.80 | 11.65% | 17.00% | 4.80% |
| Host Hotels & Resorts (HST) | 5.30% | $0.80 | 47.73% | 40.00% | 4.98% |
| Lincoln National (LNC) | 6.35% | $1.80 | 1.85% | 23.00% | 4.42% |
*Updated on October 31, 2025.
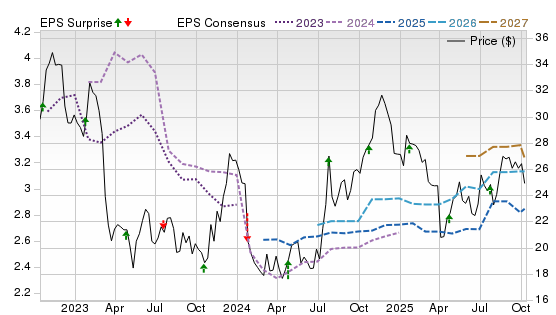
Columbia Banking System (COLB)
$26.80 USD +0.78 (3.00%)
3-Year Stock Price Performance
Premium Research for COLB
- Zacks Rank
- Hold 3
- Style Scores
B Value D Growth C Momentum C VGM
- Market Cap:$5.54B (Mid Cap)
- Last Announced Dividend Amount:$0.36
- Last Dividend Payout Date:Sept. 15, 2025
- Projected EPS Growth:5.17%
- Next EPS Report date:Oct. 30, 2025
Our Take:
Columbia Banking System is a West Coast regional bank formed by the 2023 merger with Umpqua, creating a top-30 U.S. institution with scaled retail and commercial franchises across the Pacific Northwest. More recently, the company broadened its reach through the acquisition of Pacific Premier Bancorp, enhancing its scale across desirable Western markets.
Income investors get a 5.46% dividend yield supported by a measured 51% payout, zero balance-sheet leverage, and double-digit ROE, which are the markers of through-cycle coverage. A reasonable 8.63x price-to-cash-flow further tilts the risk-reward toward steady distributions. Beyond dividends, the enlarged deposit base and lending platform offer diversified earnings and scale benefits relative to smaller community peers, positioning COLB to benefit as funding pressures normalize.
With a Value Score of B and a Rank #3 (Hold), the shares are reasonably priced while estimate trends remain steady, which is an acceptable entry point for investors seeking dependable, sustainable regional-bank income.
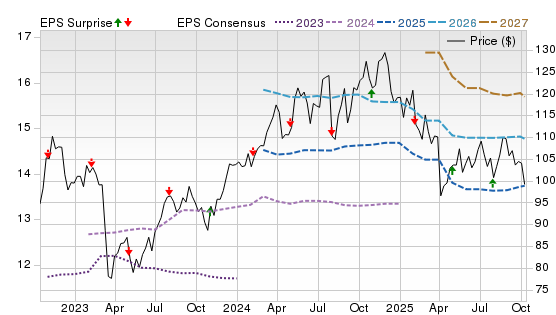
Prudential Financial (PRU)
$104.00 USD +0.91 (0.88%)
3-Year Stock Price Performance
Premium Research for PRU
- Zacks Rank
- Hold 3
- Style Scores
B Value F Growth B Momentum C VGM
- Market Cap:$35.62B (Large Cap)
- Last Announced Dividend Amount: $1.35
- Last Dividend Payout Date:Sept. 11, 2025
- Projected EPS Growth:10.14%
- Next EPS Report Date:Feb. 3, 2026
Our Take:
Prudential is a diversified insurer spanning U.S. retirement and protection, international insurance, and PGIM, its global asset manager. Fundamentally, PGIM’s scale and the firm’s ongoing simplification, such as combining credit platforms, support more diversified, fee-based earnings that complement spread and underwriting results, adding resilience to cash generation.
A 5.34% yield with a prudent 41% payout, paired with 7.25x price-to-cash-flow and mid-teens ROE, fits a steady-income mandate while leaving flexibility for capital needs across cycles. Recent developments point to strong sales trends and healthy investment results, bolstering confidence in the company’s ability to maintain its dividend.
A Value Score of B and Rank #3 point to a reasonably priced entry while estimates are stable, which is useful when targeting steady income backed by diversified, through-cycle earnings power.
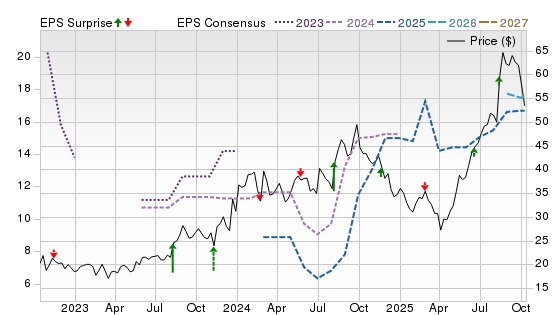
Euroseas (ESEA)
$57.54 USD -0.85 (-1.46%)
3-Year Stock Price Performance
Premium Research for ESEA
- Zacks Rank
 Hold 3
- Style Scores
A Value D Growth F Momentum C VGM
- Market Cap:$393.70M (Small Cap)
- Last Announced Dividend Amount:$0.70
- Last Dividend Payout Date:Sept. 16, 2025
- Projected EPS Growth:12.17%
- Next EPS Report date:Nov. 19, 2025
Our Take:
Euroseas is a Greece-based owner/operator of containerships serving global liner companies, with a fleet balanced between feeders and intermediate vessels. Management has secured coverage at favorable rates while introducing fuel-efficient newbuilds to reduce both unit costs and emissions.
The dividend case rests on a near-5% yield and a conservative 17% payout, supported by a very low 3.14x cash-flow multiple and modest leverage, which together provide ample cushion across freight cycles. Strategically, multi-year charters and ongoing fleet optimization help translate volatile spot markets into steadier cash flows, which is vital for dividend continuity in shipping.
A Value Score of A highlights a compelling valuation, and though the Zacks Rank is #3, positive estimate trends tied to contracted backlog and operating discipline support a sustainable income profile.
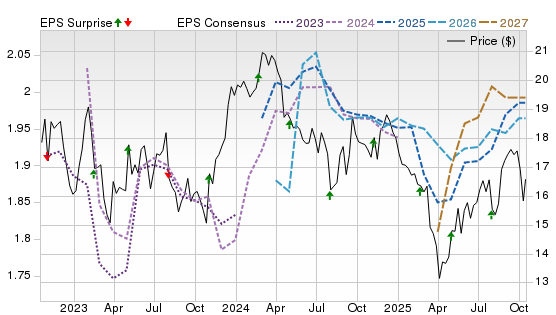
Host Hotels & Resorts (HST)
$16.02 USD -0.06 (-0.37%)
3-Year Stock Price Performance
Premium Research for HST
- Zacks Rank
 Hold 3
- Style Scores
A Value C Growth F Momentum B VGM
- Market Cap: $11.21B (Large Cap)
- Last Announced Dividend Amount: $0.20
- Last Dividend Payout Date:Oct. 15, 2025
- Projected EPS Growth:1.52%
- Next EPS Report Date: Nov. 5, 2025
Our Take:
Host is the largest U.S. lodging REIT, owning a high-quality portfolio of luxury and upper-upscale hotels, primarily under Marriott and Hyatt brands. The company’s strategy centers on holding high-quality assets, practicing disciplined reinvestment, and preserving a solid balance sheet.
Its income appeal is a 4.91% yield with a measured 40% payout and sub-1x debt/equity, supported by cash-flow visibility from top-tier assets in resilient markets. A 7.76x cash-flow multiple offers a reasonable entry for durable REIT income. Operationally, portfolio reinvestment and selective acquisitions drive mix and margin, while brand concentration with leading operators sustains pricing power through travel cycles, which is key for maintaining dividend capacity.
With a Value Score of A and a Zacks Rank #3, the shares offer balanced expectations at an undemanding valuation for investors seeking steady, asset-backed distributions.
Lincoln National (LNC)
$42.00 USD +1.31 (3.22%)
3-Year Stock Price Performance
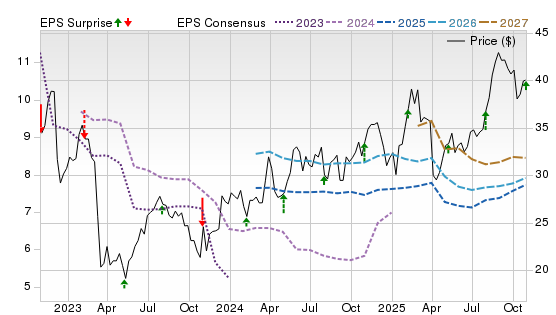
Premium Research for LNC
- Zacks Rank
 Hold 3
- Style Scores
B Value F Growth B Momentum D VGM
- Market Cap: $7.59B (Mid Cap)
- Last Announced Dividend Amount: $0.45
- Last Dividend Payout Date:Nov. 3, 2025
- Projected EPS Growth:9.19%
- Next EPS Report Date: Oct. 30, 2025
Our Take:
Lincoln National provides life insurance and retirement solutions across annuities, group benefits, and individual protection, supported by a nationwide distribution network. Earlier, Lincoln closed a $28 billion block reinsurance deal with Fortitude Re and later completed the sale of its wealth management business to Osaic, actions aimed at boosting Risk-Based Capita (RBC), free cash flow, and focus.
For income investors, the 4.5% yield stands on a conservative 23% payout and a low 5.2x price-to-cash-flow, leaving ample coverage as earnings normalize. A solid 19.1% ROE suggests the core franchises are producing returns that can comfortably fund the dividend through the cycle.
While the Zacks Rank #3 reflects neutral estimate momentum, that stability, combined with a conservative payout policy and strategic progress across its business segments, supports the case for a steady, sustainable dividend.
Methodology
The Zacks Rank is a proprietary stock-rating model that uses trends in earnings estimate revisions and earnings-per-share (EPS) surprises to classify stocks into five groups: #1 (Strong Buy), #2 (Buy), #3 (Hold), #4 (Sell) and #5 (Strong Sell). The Zacks Rank is calculated through four primary factors related to earnings estimates: analysts' consensus on earnings estimate revisions, the magnitude of revision change, the upside potential and estimate surprise (or the degree in which earnings per share deviated from the previous quarter).
Zacks builds the data from 3,000 analysts at over 150 different brokerage firms. The average yearly gain for Zacks Rank #1 (Strong Buy) stocks is +23.62% per year from January, 1988, through June 2, 2025.
For this list, only companies trading on the New York Stock Exchange or NASDAQ with a dividend yield of 4 to 6% were included. We also only evaluated stock with a low debt-to-equity ratio, as well as a conservative payout ratio and dividend growth. Only stocks with a Zacks Rank #3 (Hold) or higher were considered. All information is current as of market open, Oct. 30 2025.
Guide to Best Dividend Stocks
What Are Dividend Stocks?
Dividend stocks are shares of companies that return a portion of their earnings to shareholders on a regular basis. Rather than relying solely on stock price appreciation, dividend investors benefit from this income stream, which can complement long-term growth.
How Do Dividend Stocks Work?
Corporations that generate surplus cash may decide to share part of it with shareholders through dividends. The firm’s board will declare a dividend — often expressed as a dollar amount per share — and set a record date to identify eligible shareholders. On the payment date, the company sends the dividend (in cash or additional shares) to investors who held the stock on the record date.
Dividends typically come out of a company’s profits or free cash flow. To continue paying dividends, companies need consistent earnings, prudent capital allocation, and manageable debt levels.
How Often Do Dividend Stocks Pay in a Year?
Most U.S. dividend-paying companies distribute dividends quarterly (four times per year). Some firms choose semiannual or annual payments, depending on business norms or cash flow timing. What matters more than the frequency is consistency — companies that maintain or increase their dividend over time tend to instill more investor confidence.
Benefits and Risks of Dividend Stocks
Benefits:
- Supplemental income stream — Dividends provide cash flow even if the stock price is flat or in decline.
- Total return boost — Over long horizons, dividends have historically contributed a meaningful share of returns. (Many capital markets analyses show dividends often account for 30–50% of total equity returns.)
- Downside cushion — In volatile markets, dividend income helps offset capital losses.
- Sign of stability — Companies that consistently pay or increase dividends often have disciplined management and stable cash flows.
Risks:
- Dividend cuts — If a company hits a rough patch, it might reduce or suspend dividends, which often leads to share price declines.
- Limited growth reinvestment — High dividend payments may reduce funds available for expansion or innovation.
- Interest rate competition — When bond yields rise, dividend stocks (especially those with modest growth prospects) may look less attractive in comparison.
- Tax drag — Dividends are taxed (depending on account structure and holding period), which can eat into net return.
Dividend Stock ETFs vs Individual Stocks
When considering dividend exposure, investors have two main paths:
- Individual dividend stocks: You pick specific companies you trust to pay and grow dividends. This gives you direct control over stocks and allows targeted allocation to sectors or themes you favor.
- Dividend ETFs / mutual funds: Pools of dividend-paying stocks maintained by professional managers. These provide instant diversification, reduce individual stock risk, and simplify portfolio management.
Pros of Dividend ETFs
- Automatic diversification lowers the risk of a single holding failing.
- Fund managers monitor holdings and rebalance.
- Easier to scale and maintain, especially for smaller portfolios.
Cons of Dividend ETFs vs Individual Stocks
- Yields tend to be diluted by including lower-yielding names.
- Less control over specific holdings or sector weightings.
- Management fees may erode yields over time.
Many investors use a hybrid strategy: core allocation via a dividend ETF (for stability) supplemented by hand-picked individual dividend stocks for yield or growth.
How to Choose the Best Dividend Stocks
Not all dividend stocks are created equal. Here’s what to look for when evaluating candidates:
Dividend Yield
Yield = (Annual Dividend per Share) ÷ (Current Share Price). A moderate, well-supported yield (say 2 %–6 %, depending on sector) can be healthy, while extremely high yields often signal trouble (e.g. deep decline in share price)
Dividend Payout Ratio
This ratio shows what percentage of a company’s earnings are paid out as dividends. If a company distributes too much (e.g. > 80–90 %), it may lack flexibility to weather downturns. More conservative ratios (e.g. 30–60 %) often indicate room for future increases or a buffer in tough times.
Dividend Growth History
Look for firms that have steadily raised their dividends over years. A consistent upward trend signals confidence in future earnings. Dividend “Aristocrats” — firms in the S&P 500 that have raised dividends for at least 25 consecutive years — are often viewed as safer dividend picks.
Company Financial Health
Examine fundamentals:
- Free cash flow and cash flow stability
- Debt load and interest coverage
- Profit margins
- Growth prospects
- Competitive advantage (moat)
A company with healthy cash flow and manageable debt is more likely to sustain and grow dividends.
Sector and Market Trends
Some sectors are inherently more dividend-friendly (utilities, consumer staples, real estate, energy) because they generate steady cash flows. Others (like high-growth tech) may pay little to none in dividends as they reinvest heavily.
Also consider macro conditions — for example, rising interest rates, inflation pressures, regulatory risks — which may disproportionately affect certain sectors.
Tips for Building a Dividend Portfolio
- Start with a foundation of blue-chip dividend stocks — Established companies with strong balance sheets and long payout histories.
- Diversify across sectors — Avoid being overly concentrated in one industry (e.g. energy or REITs).
- Reinvest dividends — Using a Dividend Reinvestment Plan (DRIP) can compound returns over time.
- Allocate some portion to growth or higher-yield names, if your risk tolerance allows — but don’t let them dominate.
- Review and rebalance periodically — Monitor fundamentals, payout changes, valuation shifts, and sector dynamics.
- Use metrics and screening tools — Apply filters (yield, payout ratios, growth, fundamentals) to narrow your universe, then do deeper research.
Mistakes to Avoid about Dividend Stocks
- Chasing the highest yield blindly — extremely high yields can indicate a distressed company or impending cuts.
- Ignoring payout sustainability — yield without coverage (earnings, cash flow) is precarious.
- Overconcentration in one stock or sector — a dividend cut or sector downturn can deeply hurt.
- Neglecting growth potential — pure high-yield stocks may underperform in growth cycles.
- Forgetting taxes and fees — dividends taxed or fees eroding yield can reduce net returns.
Also, be cautious if yield spikes because of falling share price — that could be a warning sign rather than opportunity.
Frequently Asked Questions About Dividend Stocks
How are dividends taxed?
In the U.S., qualified dividends (if holding periods are met) are taxed at long-term capital gains rates (0 %, 15 %, or 20 %, depending on income bracket). Non-qualified dividends are taxed at ordinary income rates. Additionally, when you sell shares, capital gains taxes may apply to the appreciation portion.
Are dividend stocks good for retirees?
Yes. They can provide a predictable stream of income and may buffer volatility. However, retirees should emphasize safety and sustainability — favor those with strong balance sheets, stable business models, and moderate payout ratios. Also, be aware of tax effects and inflation.
What’s a good dividend yield?
There’s no one “ideal” yield. Many investors view 2 %–6 % as reasonable, depending on the sector and interest rate environment. Yields well above that range warrant extra scrutiny — high yields often come with higher risk.
Are dividend stocks safe for beginners?
They can be, especially when you start with well-known, financially sound dividend payers and diversify. The income cushion helps offset downside risk. But beginners must still research fundamentals, avoid yield traps, and avoid overconcentration.


