We use cookies to understand how you use our site and to improve your experience.
This includes personalizing content and advertising.
By pressing "Accept All" or closing out of this banner, you consent to the use of all cookies and similar technologies and the sharing of information they collect with third parties.
You can reject marketing cookies by pressing "Deny Optional," but we still use essential, performance, and functional cookies.
In addition, whether you "Accept All," Deny Optional," click the X or otherwise continue to use the site, you accept our Privacy Policy and Terms of Service, revised from time to time.
You are being directed to ZacksTrade, a division of LBMZ Securities and licensed broker-dealer. ZacksTrade and Zacks.com are separate companies. The web link between the two companies is not a solicitation or offer to invest in a particular security or type of security. ZacksTrade does not endorse or adopt any particular investment strategy, any analyst opinion/rating/report or any approach to evaluating individual securities.
If you wish to go to ZacksTrade, click OK. If you do not, click Cancel.
U.S. natural gas prices are often volatile, depending on weather, production and export demand.
The US. has seen rapid supply growth from major shale basins, keeping long-term pricing competitive.
The top natural gas stocks to buy now include Occidental Petroleum, Chord Energy and Crescent Energy.
Natural gas remains one of the most closely followed energy commodities in global markets. It heats homes during winter cold spells, supports a growing liquefied natural gas (LNG) export market, and increasingly supplies electricity to power energy-intensive infrastructure such as data centers. For investors, the right natural gas stocks can offer income, cyclical upside tied to commodity prices, and participation in long term shifts in global energy supply.
Below, we examine and rank leading natural gas stocks using a blend of Zacks Rank signals, Style Scores, and core fundamental metrics to highlight companies that may offer durable opportunities for patient investors.
This is our short term rating system that serves as a timeliness indicator for stocks over the next 1 to 3 months. How good is it? See rankings and related performance below.
The Zacks Industry Rank assigns a rating to each of the 265 X (Expanded) Industries based on their average Zacks Rank.
An industry with a larger percentage of Zacks Rank #1's and #2's will have a better average Zacks Rank than one with a larger percentage of Zacks Rank #4's and #5's.
The industry with the best average Zacks Rank would be considered the top industry (1 out of 265), which would place it in the top 1% of Zacks Ranked Industries. The industry with the worst average Zacks Rank (265 out of 265) would place in the bottom 1%.
The Zacks Sector Rank assigns a rating to each of the 16 Sectors based on their average Zacks Rank.
A sector with a larger percentage of Zacks Rank #1's and #2's will have a better average Zacks Rank than one with a larger percentage of Zacks Rank #4's and #5's.
The sector with the best average Zacks Rank would be considered the top sector (1 out of 16), which would place it in the top 1% of Zacks Ranked Sectors. The sector with the worst average Zacks Rank (16 out of 16) would place in the bottom 1%.
The Style Scores are a complementary set of indicators to use alongside the Zacks Rank. It allows the user to better focus on the stocks that are the best fit for his or her personal trading style.
The scores are based on the trading styles of Value, Growth, and Momentum. There's also a VGM Score ('V' for Value, 'G' for Growth and 'M' for Momentum), which combines the weighted average of the individual style scores into one score.
Value ScoreA
Growth ScoreA
Momentum ScoreA
VGM ScoreA
Within each Score, stocks are graded into five groups: A, B, C, D and F. As you might remember from your school days, an A, is better than a B; a B is better than a C; a C is better than a D; and a D is better than an F.
As an investor, you want to buy stocks with the highest probability of success. That means you want to buy stocks with a Zacks Rank #1 or #2, Strong Buy or Buy, which also has a Score of an A or a B in your personal trading style.
Zacks Earnings ESP (Expected Surprise Prediction) looks to find companies that have recently seen positive earnings estimate revision activity. The idea is that more recent information is, generally speaking, more accurate and can be a better predictor of the future, which can give investors an advantage in earnings season.
The technique has proven to be very useful for finding positive surprises. In fact, when combining a Zacks Rank #3 or better and a positive Earnings ESP, stocks produced a positive surprise 70% of the time, while they also saw 28.3% annual returns on average, according to our 10 year backtest.
Chord Energy is a Williston Basin producer with meaningful natural gas exposure through associated gas and NGLs tied to its oil program. In Q1 2026, Chord pointed to strong operational performance and robust free cash flow, supported by strong drilling-and-completion activities. That operational cadence supports a shareholder-return framework that can be compelling when commodity prices are volatile.
Potential Risks
Williston differentials, weather, and inflation in services can erode margins, and a single-basin footprint raises concentration risk. A heavy capital return approach can also amplify drawdowns if the cycle turns or costs re-inflate.
Forecast
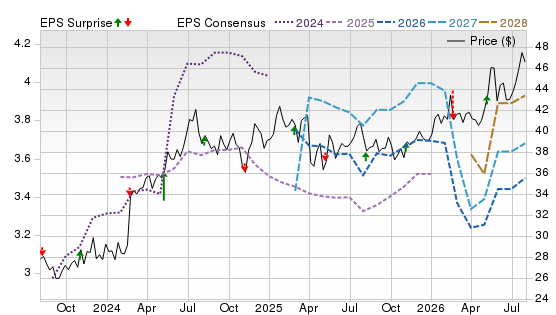
A Zacks Rank #1 (Strong Buy) with Scores of A for Value and Momentum suggests revisions and price action are aligned despite a Growth of D. The Price, Consensus & EPS Surprise chart shows 2026 EPS consensus trending lower initially, then bouncing back sharply, with a mixed but recently improving surprise pattern.
This is our short term rating system that serves as a timeliness indicator for stocks over the next 1 to 3 months. How good is it? See rankings and related performance below.
The Zacks Industry Rank assigns a rating to each of the 265 X (Expanded) Industries based on their average Zacks Rank.
An industry with a larger percentage of Zacks Rank #1's and #2's will have a better average Zacks Rank than one with a larger percentage of Zacks Rank #4's and #5's.
The industry with the best average Zacks Rank would be considered the top industry (1 out of 265), which would place it in the top 1% of Zacks Ranked Industries. The industry with the worst average Zacks Rank (265 out of 265) would place in the bottom 1%.
The Zacks Sector Rank assigns a rating to each of the 16 Sectors based on their average Zacks Rank.
A sector with a larger percentage of Zacks Rank #1's and #2's will have a better average Zacks Rank than one with a larger percentage of Zacks Rank #4's and #5's.
The sector with the best average Zacks Rank would be considered the top sector (1 out of 16), which would place it in the top 1% of Zacks Ranked Sectors. The sector with the worst average Zacks Rank (16 out of 16) would place in the bottom 1%.
The Style Scores are a complementary set of indicators to use alongside the Zacks Rank. It allows the user to better focus on the stocks that are the best fit for his or her personal trading style.
The scores are based on the trading styles of Value, Growth, and Momentum. There's also a VGM Score ('V' for Value, 'G' for Growth and 'M' for Momentum), which combines the weighted average of the individual style scores into one score.
Value ScoreA
Growth ScoreA
Momentum ScoreA
VGM ScoreA
Within each Score, stocks are graded into five groups: A, B, C, D and F. As you might remember from your school days, an A, is better than a B; a B is better than a C; a C is better than a D; and a D is better than an F.
As an investor, you want to buy stocks with the highest probability of success. That means you want to buy stocks with a Zacks Rank #1 or #2, Strong Buy or Buy, which also has a Score of an A or a B in your personal trading style.
Zacks Earnings ESP (Expected Surprise Prediction) looks to find companies that have recently seen positive earnings estimate revision activity. The idea is that more recent information is, generally speaking, more accurate and can be a better predictor of the future, which can give investors an advantage in earnings season.
The technique has proven to be very useful for finding positive surprises. In fact, when combining a Zacks Rank #3 or better and a positive Earnings ESP, stocks produced a positive surprise 70% of the time, while they also saw 28.3% annual returns on average, according to our 10 year backtest.
Crescent Energy is a multi-basin U.S. E&P with sizable natural gas and NGL exposure across its diversified production base. In Q1 2026, it beat production guidance and generated $192 million of levered free cash flow, benefiting from faster cycle times and integration gains. Management expects full-year production and capital expenditure to remain in the mid-to-high end of guidance, indicating strong business momentum. Permian synergies are running ahead of plan, strengthening the debt-reduction and shareholder-return approach.
Potential Risks
An acquisition-led model can magnify integration and inventory risk, and higher leverage leaves the stock exposed if gas and liquids prices weaken. Convertibles can also bring dilution headlines.
Forecast
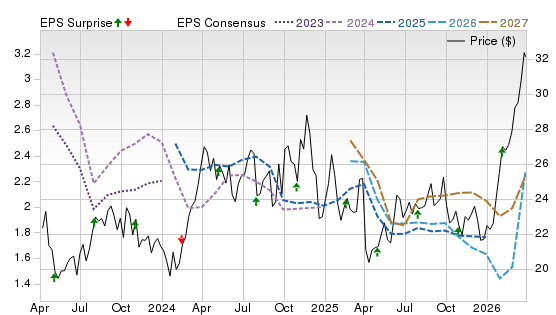
A Zacks Rank #2 (Buy) with Scores of A for Value, Momentum, and VGM suggests upbeat revisions at a reasonable setup. The company’s chart shows 2026 estimates choppy but improving lately, with recent positive earnings surprises and a late rebound in the share price.
This is our short term rating system that serves as a timeliness indicator for stocks over the next 1 to 3 months. How good is it? See rankings and related performance below.
The Zacks Industry Rank assigns a rating to each of the 265 X (Expanded) Industries based on their average Zacks Rank.
An industry with a larger percentage of Zacks Rank #1's and #2's will have a better average Zacks Rank than one with a larger percentage of Zacks Rank #4's and #5's.
The industry with the best average Zacks Rank would be considered the top industry (1 out of 265), which would place it in the top 1% of Zacks Ranked Industries. The industry with the worst average Zacks Rank (265 out of 265) would place in the bottom 1%.
The Zacks Sector Rank assigns a rating to each of the 16 Sectors based on their average Zacks Rank.
A sector with a larger percentage of Zacks Rank #1's and #2's will have a better average Zacks Rank than one with a larger percentage of Zacks Rank #4's and #5's.
The sector with the best average Zacks Rank would be considered the top sector (1 out of 16), which would place it in the top 1% of Zacks Ranked Sectors. The sector with the worst average Zacks Rank (16 out of 16) would place in the bottom 1%.
The Style Scores are a complementary set of indicators to use alongside the Zacks Rank. It allows the user to better focus on the stocks that are the best fit for his or her personal trading style.
The scores are based on the trading styles of Value, Growth, and Momentum. There's also a VGM Score ('V' for Value, 'G' for Growth and 'M' for Momentum), which combines the weighted average of the individual style scores into one score.
Value ScoreA
Growth ScoreA
Momentum ScoreA
VGM ScoreA
Within each Score, stocks are graded into five groups: A, B, C, D and F. As you might remember from your school days, an A, is better than a B; a B is better than a C; a C is better than a D; and a D is better than an F.
As an investor, you want to buy stocks with the highest probability of success. That means you want to buy stocks with a Zacks Rank #1 or #2, Strong Buy or Buy, which also has a Score of an A or a B in your personal trading style.
Zacks Earnings ESP (Expected Surprise Prediction) looks to find companies that have recently seen positive earnings estimate revision activity. The idea is that more recent information is, generally speaking, more accurate and can be a better predictor of the future, which can give investors an advantage in earnings season.
The technique has proven to be very useful for finding positive surprises. In fact, when combining a Zacks Rank #3 or better and a positive Earnings ESP, stocks produced a positive surprise 70% of the time, while they also saw 28.3% annual returns on average, according to our 10 year backtest.
Occidental Petroleum is a major U.S. oil producer with meaningful natural gas and NGL volumes and a midstream business that can cushion volatility. In Q1 2026, the company’s total production topped the high end of the outlook while it posted strong operating and free cash flow. Management’s stated focus on debt reduction and disciplined capital allocation, paired with shareholder-return commitments, is positive.
Potential Risks
The thesis still hinges on commodity prices, and cash priorities can tighten quickly if crude and gas markets weaken. A large, diverse asset base also raises execution risk around costs, decline management, and capital discipline.
Forecast
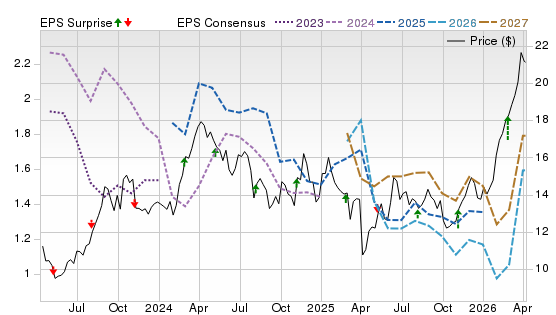
A Zacks Rank #2 with Scores of A for Value and Momentum suggests supportive revisions despite a Growth of D. The company’s chart shows the 2026 EPS consensus trending lower into early 2026, then stepping higher, while earnings surprises skew positive.
This is our short term rating system that serves as a timeliness indicator for stocks over the next 1 to 3 months. How good is it? See rankings and related performance below.
The Zacks Industry Rank assigns a rating to each of the 265 X (Expanded) Industries based on their average Zacks Rank.
An industry with a larger percentage of Zacks Rank #1's and #2's will have a better average Zacks Rank than one with a larger percentage of Zacks Rank #4's and #5's.
The industry with the best average Zacks Rank would be considered the top industry (1 out of 265), which would place it in the top 1% of Zacks Ranked Industries. The industry with the worst average Zacks Rank (265 out of 265) would place in the bottom 1%.
The Zacks Sector Rank assigns a rating to each of the 16 Sectors based on their average Zacks Rank.
A sector with a larger percentage of Zacks Rank #1's and #2's will have a better average Zacks Rank than one with a larger percentage of Zacks Rank #4's and #5's.
The sector with the best average Zacks Rank would be considered the top sector (1 out of 16), which would place it in the top 1% of Zacks Ranked Sectors. The sector with the worst average Zacks Rank (16 out of 16) would place in the bottom 1%.
The Style Scores are a complementary set of indicators to use alongside the Zacks Rank. It allows the user to better focus on the stocks that are the best fit for his or her personal trading style.
The scores are based on the trading styles of Value, Growth, and Momentum. There's also a VGM Score ('V' for Value, 'G' for Growth and 'M' for Momentum), which combines the weighted average of the individual style scores into one score.
Value ScoreA
Growth ScoreA
Momentum ScoreA
VGM ScoreA
Within each Score, stocks are graded into five groups: A, B, C, D and F. As you might remember from your school days, an A, is better than a B; a B is better than a C; a C is better than a D; and a D is better than an F.
As an investor, you want to buy stocks with the highest probability of success. That means you want to buy stocks with a Zacks Rank #1 or #2, Strong Buy or Buy, which also has a Score of an A or a B in your personal trading style.
Zacks Earnings ESP (Expected Surprise Prediction) looks to find companies that have recently seen positive earnings estimate revision activity. The idea is that more recent information is, generally speaking, more accurate and can be a better predictor of the future, which can give investors an advantage in earnings season.
The technique has proven to be very useful for finding positive surprises. In fact, when combining a Zacks Rank #3 or better and a positive Earnings ESP, stocks produced a positive surprise 70% of the time, while they also saw 28.3% annual returns on average, according to our 10 year backtest.
SM Energy is a leading U.S. shale operator with oil-led production but meaningful natural gas exposure across its multi-basin footprint. In Q1 2026, management raised its annualized synergy target from the Civitas merger to $375 million, with about $300 million already actioned. It raised the 2026 production guidance and dividend rate while keeping the capital expenditure outlook intact, hinting at improving capital efficiency as integration progresses.
Potential Risks
Any slip in capturing remaining drilling and operating synergies could hit margins. SM Energy also carries commodity and basis risk, and a smaller balance sheet can make the equity more volatile when prices fall or capital markets tighten.
Forecast
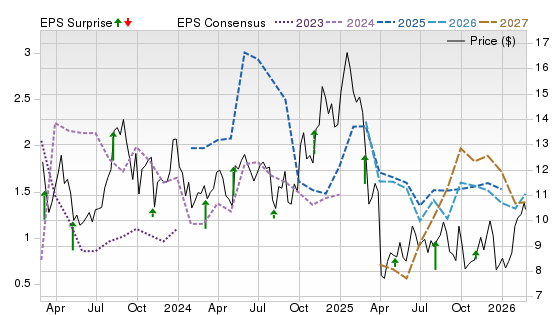
A Zacks Rank #3 (Hold) with Scores of A for Value and Momentum suggests attractive pricing and a solid trend. The chart shows 2026 EPS estimates bottoming and then jumping higher into 2027 as recent surprises skew positive.
This is our short term rating system that serves as a timeliness indicator for stocks over the next 1 to 3 months. How good is it? See rankings and related performance below.
The Zacks Industry Rank assigns a rating to each of the 265 X (Expanded) Industries based on their average Zacks Rank.
An industry with a larger percentage of Zacks Rank #1's and #2's will have a better average Zacks Rank than one with a larger percentage of Zacks Rank #4's and #5's.
The industry with the best average Zacks Rank would be considered the top industry (1 out of 265), which would place it in the top 1% of Zacks Ranked Industries. The industry with the worst average Zacks Rank (265 out of 265) would place in the bottom 1%.
The Zacks Sector Rank assigns a rating to each of the 16 Sectors based on their average Zacks Rank.
A sector with a larger percentage of Zacks Rank #1's and #2's will have a better average Zacks Rank than one with a larger percentage of Zacks Rank #4's and #5's.
The sector with the best average Zacks Rank would be considered the top sector (1 out of 16), which would place it in the top 1% of Zacks Ranked Sectors. The sector with the worst average Zacks Rank (16 out of 16) would place in the bottom 1%.
The Style Scores are a complementary set of indicators to use alongside the Zacks Rank. It allows the user to better focus on the stocks that are the best fit for his or her personal trading style.
The scores are based on the trading styles of Value, Growth, and Momentum. There's also a VGM Score ('V' for Value, 'G' for Growth and 'M' for Momentum), which combines the weighted average of the individual style scores into one score.
Value ScoreA
Growth ScoreA
Momentum ScoreA
VGM ScoreA
Within each Score, stocks are graded into five groups: A, B, C, D and F. As you might remember from your school days, an A, is better than a B; a B is better than a C; a C is better than a D; and a D is better than an F.
As an investor, you want to buy stocks with the highest probability of success. That means you want to buy stocks with a Zacks Rank #1 or #2, Strong Buy or Buy, which also has a Score of an A or a B in your personal trading style.
Zacks Earnings ESP (Expected Surprise Prediction) looks to find companies that have recently seen positive earnings estimate revision activity. The idea is that more recent information is, generally speaking, more accurate and can be a better predictor of the future, which can give investors an advantage in earnings season.
The technique has proven to be very useful for finding positive surprises. In fact, when combining a Zacks Rank #3 or better and a positive Earnings ESP, stocks produced a positive surprise 70% of the time, while they also saw 28.3% annual returns on average, according to our 10 year backtest.
Diamondback Energy is an independent oil and gas exploration and production company with its primary focus on the Permian Basin. In Q1 2026, the company generated strong free cash flow, raised its annual oil production outlook, and increased its base dividend, highlighting solid operational execution and capital efficiency. Diamondback’s focus on debt reduction has also improved financial flexibility.
Potential Risks
Permian takeaway and pricing differentials can affect the company’s cash flow. Strong momentum can also raise valuation sensitivity to any operational slip, gas-handling constraints, or service-cost inflation.
Forecast
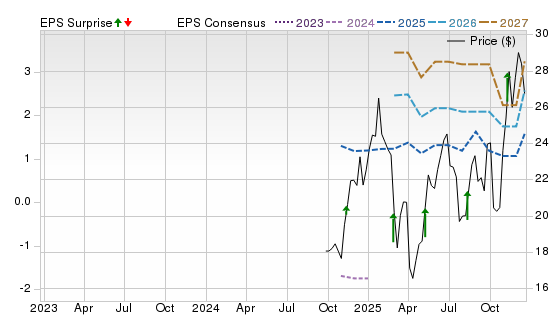
A Zacks Rank #3 with Scores of A for Momentum but C for Value and Growth suggests the setup is more execution-led. The company’s chart shows 2026 EPS estimates sliding, then snapping higher lately, with 2027 also turning up, while earnings surprises are mixed but lean to beats.
The Zacks Rank is a proprietary stock-rating model that uses trends in earnings estimate revisions and earnings-per-share (EPS) surprises to classify stocks into five groups: #1 (Strong Buy), #2 (Buy), #3 (Hold), #4 (Sell) and #5 (Strong Sell). The Zacks Rank is calculated through four primary factors related to earnings estimates: analysts' consensus on earnings estimate revisions, the magnitude of revision change, the upside potential and estimate surprise (or the degree in which earnings per share deviated from the previous quarter).
Zacks builds the data from 3,000 analysts at over 150 different brokerage firms. The average yearly gain for Zacks Rank #1 (Strong Buy) stocks is +23.62% per year from January, 1988, through June 2, 2025.
Selections for Best Natural Gas Stocks are based on the current top ranking stocks based on Zacks Indicator Score, Style Scores and fundamentals. All stocks have a daily trading volume of at least 100,000 shares and have a stock price of at least $5. All information is current as of market open, May 27, 2026.
Natural Gas Stock Market Overview and Forecast
U.S. natural gas prices have historically been volatile, responding quickly to changes in weather, production levels, and export demand. According to the U.S. Energy Information Administration (EIA), rapid supply growth from major shale basins such as the Marcellus and Permian has helped keep long-term pricing competitive. At the same time, the rise of LNG exports has introduced a powerful structural demand driver, increasingly linking U.S. prices to global energy markets.
The benchmark Henry Hub natural gas price, tracked by Trading Economics, has moved through pronounced cycles over the past decade. Periods of oversupply have pressured prices, while cold winters, infrastructure constraints, or export disruptions have triggered sharp rallies.
LNG export capacity continues to expand, positioning the United States as a key supplier to Europe and Asia. Among the companies shaping this trend are:
Cheniere Energy (LNG - Free Report) – The largest U.S. LNG exporter, backed by long-term international contracts.
Sempra (SRE - Free Report) – Which is developing LNG export terminals through its Sempra Infrastructure platform.
Meanwhile, major producers have adjusted drilling activity in response to price signals, helping moderate supply during downturns. Key players include:
EQT Corporation (EQT - Free Report) – The largest U.S. natural gas producer.
Antero Resources (AR - Free Report) – Leading Appalachian Basin producer with meaningful natural gas liquids exposure.
Comstock Resources (CRK - Free Report) – Which is heavily leveraged to Haynesville gas near Gulf Coast LNG facilities.
Is now a good time to invest in natural gas stocks?
Natural gas investing often depends more on timing than many other sectors. Periods of low prices can create opportunities in financially disciplined producers with low production costs and manageable debt.
Investors should monitor several key indicators:
Storage levels (EIA weekly reports).
Rig counts and production trends.
LNG export volumes.
Seasonal weather forecasts.
When production growth slows and export demand strengthens, natural gas equities have historically shown the ability to outperform.
General Questions about Natural Gas Stocks
What are the benefits of buying natural gas stocks?
Exposure to a critical fuel source. Gas remains essential for electricity generation and industrial use.
LNG export growth. U.S. exports have structurally increased global demand.
Dividend potential. Midstream operators such as Kinder Morgan (KMI) and Williams Companies (WMB) offer income-focused exposure.
Cyclical upside. Gas producers can see rapid earnings expansion when prices spike.
What are the risks of buying natural gas stocks?
Commodity price volatility.
Weather dependency (mild winters hurt demand).
Regulatory and environmental pressures.
High leverage in some exploration and production companies.
Natural gas producer stocks vs. pipeline stocks: which is better?
Producers (EQT, AR, CRK): Higher upside when prices rise, but more volatile.
Midstream/pipeline (KMI, WMB): Fee-based contracts provide steadier cash flow and dividends.
Income-focused investors often prefer pipelines. Growth-oriented investors may favor producers.
What’s the outlook for natural gas stocks if prices rise?
Producers typically see expanding margins and cash flow during price rallies. Companies with low breakeven costs, like EQT, tend to benefit most. Pipeline operators may see incremental volume growth but are less sensitive to price spikes.
How do natural gas stock prices correlate with commodity prices?
Producer stocks generally move in tandem with natural gas prices. However, hedging programs can mute the impact. Midstream stocks often correlate more with volume growth than spot prices.
Natural gas stocks vs natural gas ETFs
Individual stocks offer targeted exposure and dividend potential. ETFs provide diversification. Examples include:
United States Natural Gas Fund (UNG - Free Report) – Tracks natural gas futures.
Alerian MLP ETF (AMLP) – Focused on midstream MLPs.
ETFs reduce company-specific risk but may dilute upside.
What factors should I consider before buying natural gas stocks?
How important is free cash flow for natural gas companies?
Free cash flow is critical. Companies that generate excess cash during strong pricing cycles can:
Pay dividends.
Reduce debt.
Repurchase shares.
For example, Williams Companies emphasizes steady distributable cash flow tied to long-term contracts.
What debt levels are considered risky for gas producers?
High leverage magnifies downside risk when prices fall. Investors often monitor:
Net debt-to-EBITDA ratios.
Interest coverage.
Debt maturity schedules.
Producers operating near 3.0x–4.0x leverage can face pressure during downturns.
How do hedging strategies affect natural gas stock performance?
Hedging locks in future prices. This reduces volatility but may limit upside during rallies. Companies that hedge aggressively may lag during sharp commodity spikes.
Strategy and Portfolio Building with Natural Gas Stocks
Are natural gas stocks suitable for beginners?
They can be — if investors understand commodity cycles. Midstream dividend stocks may be more beginner-friendly than highly leveraged producers.
What natural gas stocks are good for long-term investing?
Long-term candidates often include:
Cheniere Energy (LNG) – Long-term LNG export contracts.
Williams Companies (WMB - Free Report) – Extensive U.S. pipeline network.
Kinder Morgan (KMI - Free Report) – Diversified gas infrastructure footprint.
These companies benefit from structural LNG demand growth rather than short-term weather swings.
How do natural gas stocks fit into an energy portfolio?
Natural gas can balance oil-heavy portfolios. Gas demand tends to be driven more by electricity and heating than transportation. Combining oil majors with gas-focused names adds diversification across commodities.
What are common mistakes investors make with natural gas stocks?
Buying after price spikes.
Ignoring balance sheet risk.
Overestimating short-term weather events.
Confusing LNG infrastructure stocks with upstream producers.
Should investors time the natural gas market or dollar-cost average?
Because natural gas is highly cyclical, dollar-cost averaging can reduce timing risk. However, experienced investors sometimes increase exposure during periods of low prices and production cutbacks.
What are the alternatives if you’re bearish on natural gas prices?
Focus on integrated majors with diversified revenue streams.
Invest in midstream companies less sensitive to price swings.
Allocate to renewable energy or utility stocks instead.
Bottom Line
The best natural gas stocks combine disciplined balance sheets, strong free cash flow, and exposure to long-term LNG export growth. Companies like EQT, Cheniere Energy, and Williams Companies illustrate different ways to gain exposure — from pure production leverage to fee-based infrastructure income.
As always, natural gas investing requires attention to commodity cycles, storage data, and global demand trends. For investors willing to tolerate volatility, the sector can offer both income and upside potential in an evolving global energy market.