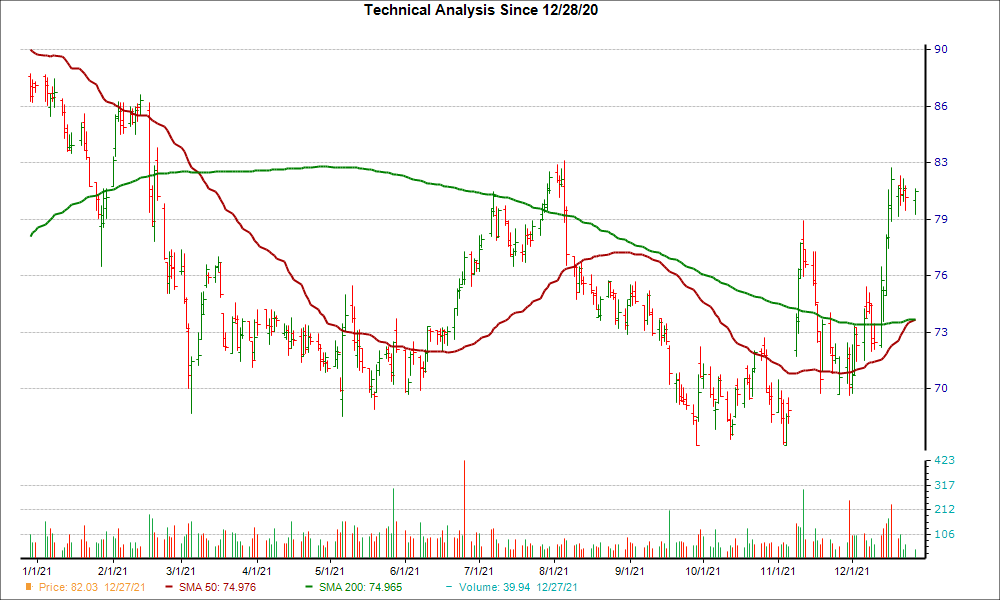
Black Knight Financial Services, Inc. is looking like an interesting pick from a technical perspective, as the company reached a key level of support. Recently, BKI's 50-day simple moving average crossed above its 200-day simple moving average, known as a "golden cross."
There's a reason traders love a golden cross -- it's a technical chart pattern that can indicate a bullish breakout is on the horizon. This kind of crossover is formed when a stock's short-term moving average breaks above a longer-term moving average. Typically, a golden cross involves the 50-day and the 200-day moving averages, since bigger time periods tend to form stronger breakouts.
A successful golden cross event has three stages. It first begins when a stock's price on the decline bottoms out. Then, its shorter moving average crosses above its longer moving average, triggering a positive trend reversal. The third and final phase occurs when the stock maintains its upward momentum.
A golden cross is the opposite of a death cross, another technical event that indicates bearish price movement may be on the horizon.
BKI could be on the verge of a breakout after moving 12.2% higher over the last four weeks. Plus, the company is currently a #2 (Buy) on the Zacks Rank.
Looking at BKI's earnings expectations, investors will be even more convinced of the bullish uptrend. For the current quarter, there have been 8 changes higher compared to none lower over the past 60 days, and the Zacks Consensus Estimate has moved up as well.
Given this move in earnings estimates and the positive technical factor, investors may want to keep their eye on BKI for more gains in the near future.
Image: Bigstock
Black Knight (BKI)'s Technical Outlook is Bright After Key Golden Cross
Black Knight Financial Services, Inc. is looking like an interesting pick from a technical perspective, as the company reached a key level of support. Recently, BKI's 50-day simple moving average crossed above its 200-day simple moving average, known as a "golden cross."
There's a reason traders love a golden cross -- it's a technical chart pattern that can indicate a bullish breakout is on the horizon. This kind of crossover is formed when a stock's short-term moving average breaks above a longer-term moving average. Typically, a golden cross involves the 50-day and the 200-day moving averages, since bigger time periods tend to form stronger breakouts.
A successful golden cross event has three stages. It first begins when a stock's price on the decline bottoms out. Then, its shorter moving average crosses above its longer moving average, triggering a positive trend reversal. The third and final phase occurs when the stock maintains its upward momentum.
A golden cross is the opposite of a death cross, another technical event that indicates bearish price movement may be on the horizon.
BKI could be on the verge of a breakout after moving 12.2% higher over the last four weeks. Plus, the company is currently a #2 (Buy) on the Zacks Rank.
Looking at BKI's earnings expectations, investors will be even more convinced of the bullish uptrend. For the current quarter, there have been 8 changes higher compared to none lower over the past 60 days, and the Zacks Consensus Estimate has moved up as well.
Given this move in earnings estimates and the positive technical factor, investors may want to keep their eye on BKI for more gains in the near future.