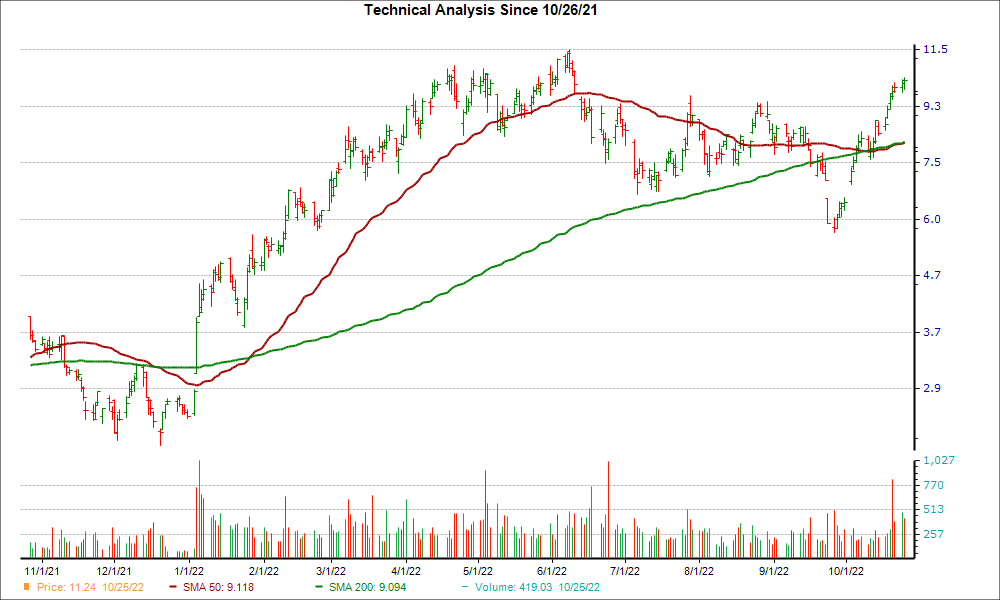
NexTier Oilfield Solutions Inc. reached a significant support level, and could be a good pick for investors from a technical perspective. Recently, NEX's 50-day simple moving average broke out above its 200-day moving average; this is known as a "golden cross."
There's a reason traders love a golden cross -- it's a technical chart pattern that can indicate a bullish breakout is on the horizon. This kind of crossover is formed when a stock's short-term moving average breaks above a longer-term moving average. Typically, a golden cross involves the 50-day and the 200-day moving averages, since bigger time periods tend to form stronger breakouts.
A successful golden cross event has three stages. It first begins when a stock's price on the decline bottoms out. Then, its shorter moving average crosses above its longer moving average, triggering a positive trend reversal. The third and final phase occurs when the stock maintains its upward momentum.
A golden cross contrasts with a death cross, another widely-followed chart pattern that suggests bearish momentum could be on the horizon.
Shares of NEX have been moving higher over the past four weeks, up 65.5%. Plus, the company is currently a #2 (Buy) on the Zacks Rank, suggesting that NEX could be poised for a breakout.
Once investors consider NEX's positive earnings outlook for the current quarter, the bullish case only solidifies. No earnings estimate has gone lower in the past two months compared to 2 revisions higher, and the Zacks Consensus Estimate has increased as well.
Investors may want to watch NEX for more gains in the near future given the company's key technical level and positive earnings estimate revisions.
Image: Bigstock
After Golden Cross, NexTier Oilfield Solutions (NEX)'s Technical Outlook is Bright
NexTier Oilfield Solutions Inc. reached a significant support level, and could be a good pick for investors from a technical perspective. Recently, NEX's 50-day simple moving average broke out above its 200-day moving average; this is known as a "golden cross."
There's a reason traders love a golden cross -- it's a technical chart pattern that can indicate a bullish breakout is on the horizon. This kind of crossover is formed when a stock's short-term moving average breaks above a longer-term moving average. Typically, a golden cross involves the 50-day and the 200-day moving averages, since bigger time periods tend to form stronger breakouts.
A successful golden cross event has three stages. It first begins when a stock's price on the decline bottoms out. Then, its shorter moving average crosses above its longer moving average, triggering a positive trend reversal. The third and final phase occurs when the stock maintains its upward momentum.
A golden cross contrasts with a death cross, another widely-followed chart pattern that suggests bearish momentum could be on the horizon.
Shares of NEX have been moving higher over the past four weeks, up 65.5%. Plus, the company is currently a #2 (Buy) on the Zacks Rank, suggesting that NEX could be poised for a breakout.
Once investors consider NEX's positive earnings outlook for the current quarter, the bullish case only solidifies. No earnings estimate has gone lower in the past two months compared to 2 revisions higher, and the Zacks Consensus Estimate has increased as well.
Investors may want to watch NEX for more gains in the near future given the company's key technical level and positive earnings estimate revisions.