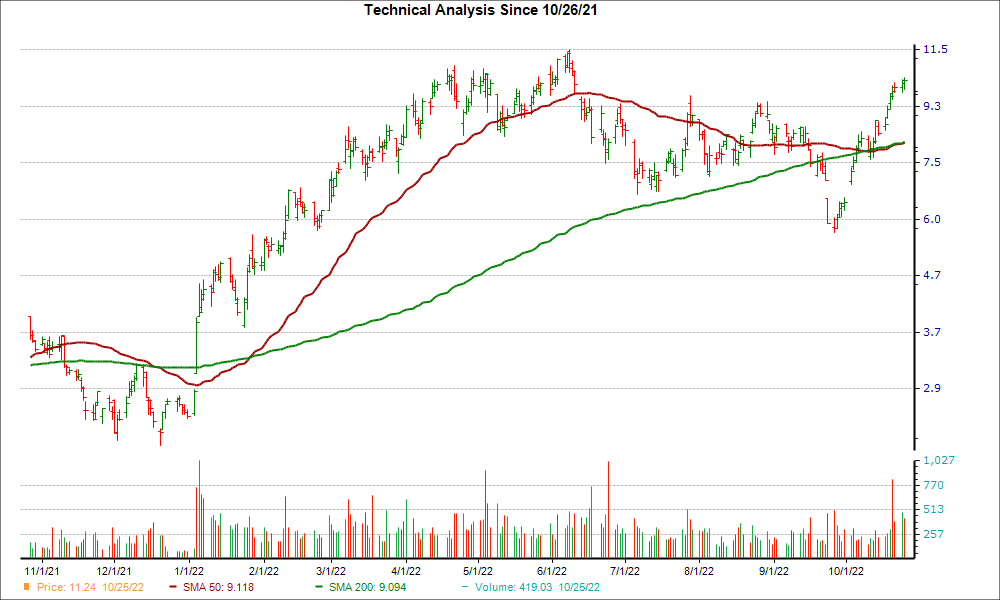
After reaching an important support level, NexTier Oilfield Solutions Inc. could be a good stock pick from a technical perspective. NEX recently experienced a "golden cross" event, which saw its 50-day simple moving average breaking out above its 200-day simple moving average.
A golden cross is a technical chart pattern that can signify a potential bullish breakout. It's formed from a crossover involving a security's short-term moving average breaking above a longer-term moving average, with the most common moving averages being the 50-day and the 200-day, since bigger time periods tend to form stronger breakouts.
A successful golden cross event has three stages. It first begins when a stock's price on the decline bottoms out. Then, its shorter moving average crosses above its longer moving average, triggering a positive trend reversal. The third and final phase occurs when the stock maintains its upward momentum.
A golden cross is the opposite of a death cross, another technical event that indicates bearish price movement may be on the horizon.
Over the past four weeks, NEX has gained 60.1%. The company currently sits at a #1 (Strong Buy) on the Zacks Rank, also indicating that the stock could be poised for a breakout.
The bullish case only gets stronger once investors take into account NEX's positive earnings outlook for the current quarter. There have been 1 upwards revisions compared to none lower over the past 60 days, and the Zacks Consensus Estimate has moved up as well.
Investors should think about putting NEX on their watchlist given the ultra-important technical indicator and positive move in earnings estimates.
Image: Bigstock
NexTier Oilfield Solutions (NEX) Just Flashed Golden Cross Signal: Do You Buy?
After reaching an important support level, NexTier Oilfield Solutions Inc. could be a good stock pick from a technical perspective. NEX recently experienced a "golden cross" event, which saw its 50-day simple moving average breaking out above its 200-day simple moving average.
A golden cross is a technical chart pattern that can signify a potential bullish breakout. It's formed from a crossover involving a security's short-term moving average breaking above a longer-term moving average, with the most common moving averages being the 50-day and the 200-day, since bigger time periods tend to form stronger breakouts.
A successful golden cross event has three stages. It first begins when a stock's price on the decline bottoms out. Then, its shorter moving average crosses above its longer moving average, triggering a positive trend reversal. The third and final phase occurs when the stock maintains its upward momentum.
A golden cross is the opposite of a death cross, another technical event that indicates bearish price movement may be on the horizon.
Over the past four weeks, NEX has gained 60.1%. The company currently sits at a #1 (Strong Buy) on the Zacks Rank, also indicating that the stock could be poised for a breakout.
The bullish case only gets stronger once investors take into account NEX's positive earnings outlook for the current quarter. There have been 1 upwards revisions compared to none lower over the past 60 days, and the Zacks Consensus Estimate has moved up as well.
Investors should think about putting NEX on their watchlist given the ultra-important technical indicator and positive move in earnings estimates.