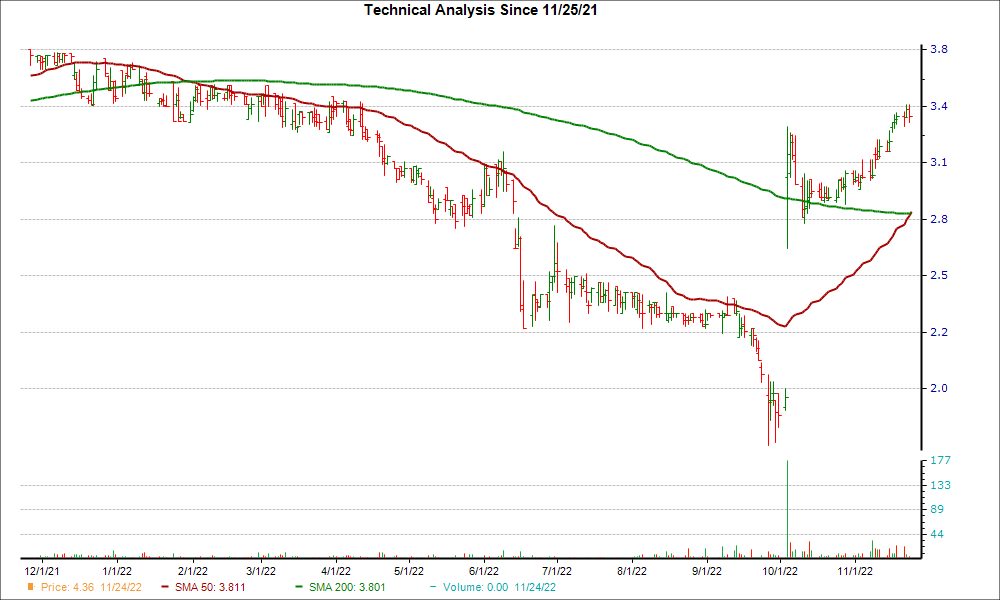
After reaching an important support level, First Eagle Alternative Capital BDC, Inc. could be a good stock pick from a technical perspective. FCRD recently experienced a "golden cross" event, which saw its 50-day simple moving average breaking out above its 200-day simple moving average.
A golden cross is a technical chart pattern that can signify a potential bullish breakout. It's formed from a crossover involving a security's short-term moving average breaking above a longer-term moving average, with the most common moving averages being the 50-day and the 200-day, since bigger time periods tend to form stronger breakouts.
There are three stages to a golden cross. First, there must be a downtrend in a stock's price that eventually bottoms out. Then, the stock's shorter moving average crosses over its longer moving average, triggering a positive trend reversal. The third stage is when a stock continues the upward momentum to higher prices.
This kind of chart pattern is the opposite of a death cross, which is a technical event that suggests future bearish price movement.
FCRD could be on the verge of a breakout after moving 10.4% higher over the last four weeks. Plus, the company is currently a #2 (Buy) on the Zacks Rank.
The bullish case solidifies once investors consider FCRD's positive earnings outlook. For the current quarter, no earnings estimate has been cut compared to 1 revisions higher in the past 60 days. The Zacks Consensus Estimate has increased too.
With a winning combination of earnings estimate revisions and hitting a key technical level, investors should keep their eye on FCRD for more gains in the near future.
Image: Bigstock
First Eagle Alternative (FCRD) Just Flashed Golden Cross Signal: Do You Buy?
After reaching an important support level, First Eagle Alternative Capital BDC, Inc. could be a good stock pick from a technical perspective. FCRD recently experienced a "golden cross" event, which saw its 50-day simple moving average breaking out above its 200-day simple moving average.
A golden cross is a technical chart pattern that can signify a potential bullish breakout. It's formed from a crossover involving a security's short-term moving average breaking above a longer-term moving average, with the most common moving averages being the 50-day and the 200-day, since bigger time periods tend to form stronger breakouts.
There are three stages to a golden cross. First, there must be a downtrend in a stock's price that eventually bottoms out. Then, the stock's shorter moving average crosses over its longer moving average, triggering a positive trend reversal. The third stage is when a stock continues the upward momentum to higher prices.
This kind of chart pattern is the opposite of a death cross, which is a technical event that suggests future bearish price movement.
FCRD could be on the verge of a breakout after moving 10.4% higher over the last four weeks. Plus, the company is currently a #2 (Buy) on the Zacks Rank.
The bullish case solidifies once investors consider FCRD's positive earnings outlook. For the current quarter, no earnings estimate has been cut compared to 1 revisions higher in the past 60 days. The Zacks Consensus Estimate has increased too.
With a winning combination of earnings estimate revisions and hitting a key technical level, investors should keep their eye on FCRD for more gains in the near future.