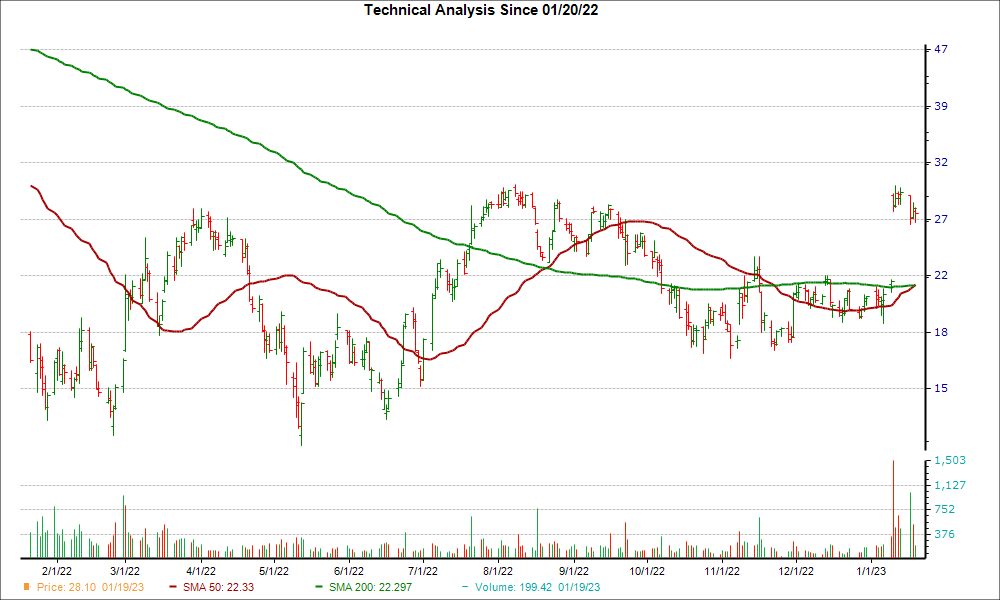
Oak Street Health, Inc. reached a significant support level, and could be a good pick for investors from a technical perspective. Recently, OSH's 50-day simple moving average broke out above its 200-day moving average; this is known as a "golden cross."
Considered an important signifier for a bullish breakout, a golden cross is a technical chart pattern that's formed when a stock's short-term moving average breaks above a longer-term moving average; the most common crossover involves the 50-day and the 200-day, since bigger time periods tend to form stronger breakouts.
There are three stages to a golden cross. First, there must be a downtrend in a stock's price that eventually bottoms out. Then, the stock's shorter moving average crosses over its longer moving average, triggering a positive trend reversal. The third stage is when a stock continues the upward momentum to higher prices.
This kind of chart pattern is the opposite of a death cross, which is a technical event that suggests future bearish price movement.
OSH has rallied 28.4% over the past four weeks, and the company is a #2 (Buy) on the Zacks Rank at the moment. This combination indicates OSH could be poised for a breakout.
The bullish case solidifies once investors consider OSH's positive earnings outlook. For the current quarter, no earnings estimate has been cut compared to 2 revisions higher in the past 60 days. The Zacks Consensus Estimate has increased too.
With a winning combination of earnings estimate revisions and hitting a key technical level, investors should keep their eye on OSH for more gains in the near future.
Image: Bigstock
Oak Street Health, Inc. (OSH)'s Technical Outlook is Bright After Key Golden Cross
Oak Street Health, Inc. reached a significant support level, and could be a good pick for investors from a technical perspective. Recently, OSH's 50-day simple moving average broke out above its 200-day moving average; this is known as a "golden cross."
Considered an important signifier for a bullish breakout, a golden cross is a technical chart pattern that's formed when a stock's short-term moving average breaks above a longer-term moving average; the most common crossover involves the 50-day and the 200-day, since bigger time periods tend to form stronger breakouts.
There are three stages to a golden cross. First, there must be a downtrend in a stock's price that eventually bottoms out. Then, the stock's shorter moving average crosses over its longer moving average, triggering a positive trend reversal. The third stage is when a stock continues the upward momentum to higher prices.
This kind of chart pattern is the opposite of a death cross, which is a technical event that suggests future bearish price movement.
OSH has rallied 28.4% over the past four weeks, and the company is a #2 (Buy) on the Zacks Rank at the moment. This combination indicates OSH could be poised for a breakout.
The bullish case solidifies once investors consider OSH's positive earnings outlook. For the current quarter, no earnings estimate has been cut compared to 2 revisions higher in the past 60 days. The Zacks Consensus Estimate has increased too.
With a winning combination of earnings estimate revisions and hitting a key technical level, investors should keep their eye on OSH for more gains in the near future.