
Image: Bigstock
Best Stocks to Buy Now for January 2026
5 Best Stocks to Buy Today
| Company (Ticker) | 12 Week Price Change | Forward PE | Price | Proj EPS Growth (1 Year) | Projected Sales Growth (1Y) |
|---|---|---|---|---|---|
| Dollar General (DG) | 39.85% | 23.00 | $151.25 | 9.33% | 4.79% |
| Array Technologies (ARRY) | 11.35% | 10.35 | $10.00 | 44.62% | 18.38% |
| AngioDynamics (ANGO) | -13.88% | NA | $10.07 | -80.00% | 6.40% |
| Ternium (TX) | 11.55% | 5.44 | $41.56 | 148.11% | 11.10% |
| Aura Minerals Inc. (AUGO) | 51.22% | 7.11 | $57.41 | 660.95% | NA |
*Updated on January 13, 2026.
Dollar General (DG)
$151.25 USD +2.39 (1.61%)
3-Year Stock Price Performance
Premium Research for DG
- Zacks Rank
 Strong Buy 1
- Style Scores
B Value B Growth B Momentum A VGM
- Market Cap:$31.42 B (Large Cap)
- Projected EPS Growth:9.29%
- Last Quarter EPS Growth:-31.18%
- Last EPS Surprise:39.13%
- Next EPS Report date:March 12, 2026
Our Take:
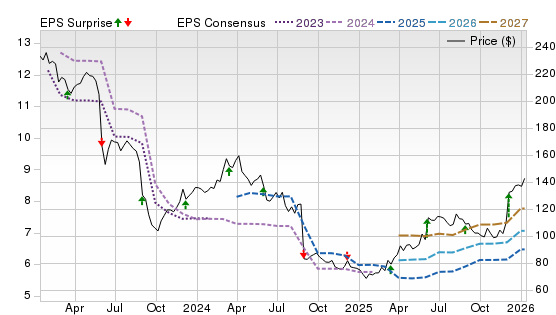
Dollar General runs a dense network of small-box discount stores focused on everyday essentials in rural and small-town America. The stock carries a Zacks Rank #1 (Strong Buy). Style Scores of B for Value and Growth point to attractive valuation and improving earnings power, while a C for Momentum suggests the recent rebound is still developing rather than overextended.
Operationally, the Vasos-led reset is gaining traction, and recent updates showed comps growth and gross-margin improvement. Management also laid out a 2026 real-estate plan that balances selective closures and remodels with disciplined new-unit growth. The company continues to leverage DG Fresh and expand cooler capacity to sharpen in-stock levels and mix.
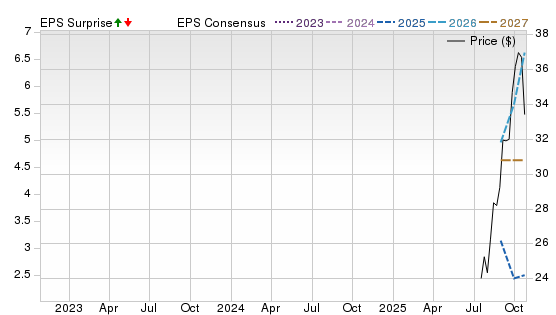
The Price, Consensus & EPS Surprise chart shows a steep 2024 drawdown followed by a base and nascent uptrend as 2026–2027 EPS estimates stabilize and edge higher, consistent with a turnaround moving from defense to execution.
Array Technologies (ARRY)
$10.00 USD -0.01 (-0.10%)
3-Year Stock Price Performance
Premium Research for ARRY
- Zacks Rank
- Strong Buy 1
- Style Scores
B Value B Growth D Momentum B VGM
- Market Cap:$1.37 B (Small Cap)
- Projected EPS Growth:11.67%
- Last Quarter EPS Growth:17.39%
- Last EPS Surprise:42.86%
- Next EPS Report date:February 26, 2026
Our Take:
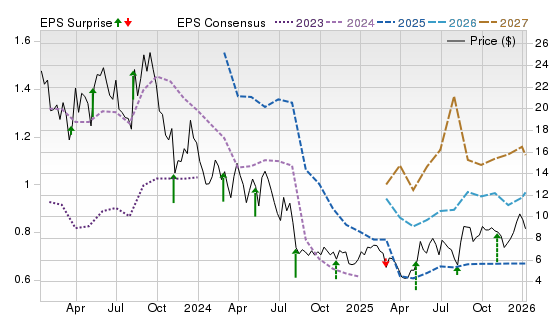
Array Technologies designs, engineers, and manufactures utility-scale solar trackers and related software to boost energy output for solar projects worldwide. The stock holds a Zacks Rank #1. Style Scores of B for Value and Momentum suggest reasonable valuation with improving sentiment, while a C for Growth tempers expectations.
Fundamentally, ARRY is benefiting from a rebound in U.S. utility-scale activity, a better mix and cost discipline, and policy tailwinds. Management’s November update showed Q3 2025 revenue up sharply with strong volumes and adjusted EBITDA. The completed acquisition of APA Solar adds foundations and fixed-tilt offerings, broadening integration and margin potential.
The chart shows shares basing near multi-year lows after a long reset in 2024–2025 as 2025 estimates fell, with 2026–2027 consensus beginning to recover and price starting to follow. That aligns with the Rank and stabilizing fundamentals, though tariff and policy noise remain watch items.
AngioDynamics (ANGO)
$10.07 USD -0.11 (-1.08%)
3-Year Stock Price Performance
Premium Research for ANGO
- Zacks Rank
- Strong Buy 1
- Style Scores
C Value A Growth A Momentum A VGM
- Market Cap:$406.40 M (Small Cap)
- Projected EPS Growth:-80.00%
- Last Quarter EPS Growth:100.00%
- Last EPS Surprise:100.00%
- Next EPS Report date:April 1, 2026
Our Take:
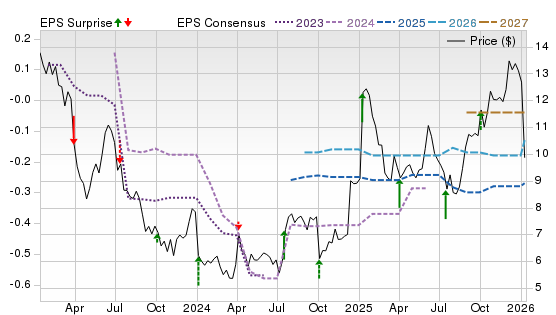
AngioDynamics develops minimally invasive technologies across peripheral thrombectomy, arterial disease, and oncology, including AlphaVac/AngioVac clot‐removal, the Auryon atherectomy platform, and the NanoKnife irreversible electroporation system. The stock holds a Zacks Rank #1. With A scores for Growth and Momentum and C for Value, the quantitative profile points to strengthening fundamentals and constructive price action rather than deep value.
Execution has improved. In fiscal Q2 2026, Med Tech revenue rose 13%, and total sales grew 8.8%. Management lifted full-year guidance and reiterated an expectation for positive cash flow. Recent catalysts include 510(k) clearance expanding AlphaVac indications, IDE approvals for new AlphaVac/AngioVac trials. Portfolio pruning, selling PICC/midline, and exiting RF ablation have further shifted the mix toward higher-margin platforms.
On the chart, shares bottomed through 2024–early 2025, then based and turned higher as 2026–2027 EPS estimates stabilized and nudged up, consistent with accelerating Med Tech traction and recent regulatory milestones.
Ternium (TX)
$41.56 USD +1.09 (2.69%)
3-Year Stock Price Performance
Premium Research for TX
- Zacks Rank
- Strong Buy 1
- Style Scores
A Value D Growth A Momentum B VGM
- Market Cap:$8.03 B (Mid Cap)
- Projected EPS Growth:86.34%
- Last Quarter EPS Growth:-92.19%
- Last EPS Surprise:-87.18%
- Next EPS Report date:Feb. 17, 2026
Our Take:
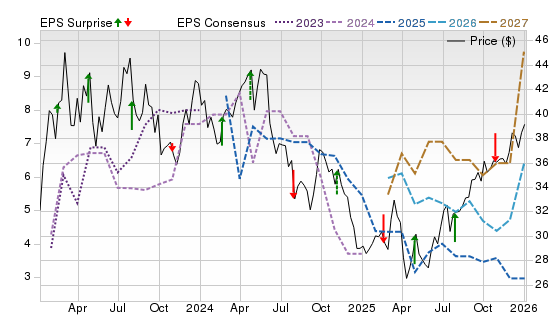
Ternium produces flat and long steel across Mexico, Argentina, and Brazil, anchored by an integrated hub in Pesquería, Mexico. Its Zacks Rank #1 reflects rising earnings estimates. Style Scores of A for Value and Momentum suggest an inexpensive cyclical setup with improving price action, while an F for Growth simply reflects trough earnings against tough comps.
Its latest quarter showed improving adjusted EBITDA on lower raw-material and purchased-slab costs. Policy tailwinds are building. Ternium has pushed for tighter USMCA rules as Mexico steps up protection against unfair steel imports, moves that could bolster domestic pricing into 2026. Strategically, Ternium also sought to consolidate its control at Usiminas in Brazil, thereby strengthening its regional footprint amid shifting trade dynamics under the USMCA.
On the chart, 2025 estimates reset and shares churned; 2027 EPS has turned up, and price is recovering, consistent with the Rank and Momentum profile heading into the Mexico ramp.
Aura Minerals Inc. (AUGO)
$57.41 USD +0.61 (1.07%)
3-Year Stock Price Performance
Premium Research for AUGO
- Zacks Rank
- Strong Buy 1
- Style Scores
D Value A Growth A Momentum B VGM
- Market Cap:$4.36 B (Mid Cap)
- Projected EPS Growth:-7.08%
- Last Quarter EPS Growth:71.43%
- Last EPS Surprise:-13.40%
- Next EPS Report date:Feb. 25, 2026
Our Take:
Aura Minerals is a gold- and copper-focused producer with operating mines in Brazil, Mexico, and Honduras and a growing pipeline in Guatemala. The stock’s Zacks Rank #1 points to positive estimate revisions. Style Scores of A for Growth and Momentum suggest strengthening earnings power and constructive price action, while a D for Value implies investors are paying for that traction.
Fundamentals are inflecting. Aura closed 2025 with record quarterly and full-year production, hitting the upper half of guidance as Borborema reached commercial status and ramped throughput and recoveries. The December purchase of the Serra Grande mine from AngloGold adds a producing Brazilian asset with room for operational improvements. Early works are underway at the Era Dorada project in Guatemala after securing its construction license, extending the growth runway.
On the chart, shares have rallied since the mid-2025 U.S. listing, with 2026 estimates rising and an emerging 2027 track, consistent with the Rank and momentum profile.
Best Stocks to Buy Now: How to Use This List
It’s important to understand what this list is, and what it isn’t.
For decades, the Zacks Rank has been a proven system that has helped investors identify stocks most likely to outperform. Instead of relying on hunches or hype, it’s grounded in earnings estimate revisions — a factor strongly correlated with stock price movement. When combined with additional fundamental metrics, the approach becomes even more powerful.
Still, it’s important to understand these basics:
- While the list offers exposure across several industries, it is not a fully diversified portfolio. You should think of it as a starting point, not a complete investing strategy.
- Even though these stocks are backed by a proven system, nothing protects you from short-term downside. Depending on market conditions, most — or even all — could decline in the near term.
- The Zacks Rank works because it captures trends in earnings momentum. That power plays out over weeks and months, not days. Investors with patience and discipline are more likely to benefit.
- Before buying any single stock, check how it aligns with your goals, risk tolerance, and broader portfolio.
Methodology
The Zacks Rank is a proprietary stock-rating model that uses trends in earnings estimate revisions and earnings-per-share (EPS) surprises to classify stocks into five groups: #1 (Strong Buy), #2 (Buy), #3 (Hold), #4 (Sell) and #5 (Strong Sell). The Zacks Rank is calculated through four primary factors related to earnings estimates: analysts' consensus on earnings estimate revisions, the magnitude of revision change, the upside potential and estimate surprise (or the degree in which earnings per share deviated from the previous quarter).
Zacks builds the data from 3,000 analysts at over 150 different brokerage firms. The average yearly gain for Zacks Rank #1 (Strong Buy) stocks is +23.62% per year from January, 1988, through June 2, 2025.
For this list, only companies in the top 50% of industries that have average daily trading volumes of 100,000 shares or more were considered. Stocks with a share value of $5 or less were excluded. These companies earned Zacks Rank #1 (Strong Buy) between Dec. 29, 2025 and Jan. 10, 2026. All information is current as of market open, Jan. 12, 2026.
Common Questions of New Investors
Where to Buy Stocks
To invest in stocks, you must open a brokerage account, fund the account and purchase stocks through your selected brokerage. Investors may also purchase stocks through a financial advisor or an automated robo advisor. Some publicly traded companies also offer a direct stock purchase plan, where you can purchase shares directly from the company.
Alternative Ways to Invest in Stocks
You can also invest in stock funds, such as mutual funds, index funds and exchange-traded funds, where the fund managers select the pool of stocks that follow an investing strategy. These funds may broadly cover an entire index, such as the S&P 500, or specific types of stocks, such as industries like technology and energy companies, company size such as small cap companies, or location like international companies.
How to Start Investing in Stocks Today
It’s easy to start investing by opening an online brokerage account. Opening a standard brokerage account takes about 20 minutes and you’ll need to have some personal information ready, such as your social security number and your bank details to fund your account.
You’ll need to decide whether to open a taxable account (most common), a tax-deferred retirement account such as a traditional IRA or a tax-free retirement account such as a Roth IRA, which is funded with after-tax dollars, but qualified withdrawals are tax-free. A margin account allows for borrowing to purchase stocks and is best for experienced traders.
Set goals before you begin investing – determine how much you can afford to invest and your tolerance for risk.
What to Look for When You Buy Stocks?
The goal in all equities investment is to buy low and sell high, growing your wealth over time. Researching the companies to invest in is key – what kind of product or service do they offer? How do they compare with competitors? How fast are they growing? Does the stock pay regular dividends to shareholders? Does the stock help diversify your portfolio by giving you exposure to a market segment you currently don’t hold?
Understanding fundamental analysis can help determine whether the stock has the potential for growth at its current purchase price. Factors that can help determine that include earnings per share (EPS), price-to-earnings ratio and PE growth. Technical analysis is used looking at statistical patterns to potentially predict future price moves. Some investors may look for a growth and income strategy, looking for stocks with solid revenues that pay good dividends, or a value strategy, looking if a current stock price is below what their revenue, EPS and other factors suggest.
Analysts also often look for the momentum of a stock by looking at moving averages of a stock's closing price over a 50-day, 100-day or 12-month trailing time period to determine signals whether to buy or sell a stock.


 Stocks to Buy Now January 2026")

