We use cookies to understand how you use our site and to improve your experience.
This includes personalizing content and advertising.
By pressing "Accept All" or closing out of this banner, you consent to the use of all cookies and similar technologies and the sharing of information they collect with third parties.
You can reject marketing cookies by pressing "Deny Optional," but we still use essential, performance, and functional cookies.
In addition, whether you "Accept All," Deny Optional," click the X or otherwise continue to use the site, you accept our Privacy Policy and Terms of Service, revised from time to time.
You are being directed to ZacksTrade, a division of LBMZ Securities and licensed broker-dealer. ZacksTrade and Zacks.com are separate companies. The web link between the two companies is not a solicitation or offer to invest in a particular security or type of security. ZacksTrade does not endorse or adopt any particular investment strategy, any analyst opinion/rating/report or any approach to evaluating individual securities.
If you wish to go to ZacksTrade, click OK. If you do not, click Cancel.
Energy stocks are a closely watched market, shaped by price pressures, geopolitics and environmental concerns.
Energy equities are diverse, from traditional oil and gas functions to electrification and renewable power.
The best energy stocks to buy now are five firms, including HF Sinclair, Marathon Petroleum and Ovintiv.
The energy sector remains one of the most closely watched corners of the market, shaped by shifting oil prices, geopolitical events, infrastructure spending, and the long-term global transition toward lower-carbon systems.
Is Now a Good Time to Invest in Energy Stocks?
Energy stocks have historically moved with the price of crude oil and natural gas, but today their outlook is influenced by broader forces, including global security issues, OPEC+ production decisions, U.S. shale output, clean-energy incentives and interest-rate expectations.
While short-term volatility remains common, many analysts argue the sector’s capital discipline, record free-cash-flow generation and above-market dividend yields make it attractive for long-term investors. Renewables, meanwhile, have seen recent pressure due to higher financing costs but continue to benefit from multi-decade decarbonization trends.
Here, we analyze and rank the best energy stocks to buy now ranked on a blend Zacks Rank signals, Style Scores and fundamentals:
This is our short term rating system that serves as a timeliness indicator for stocks over the next 1 to 3 months. How good is it? See rankings and related performance below.
The Zacks Industry Rank assigns a rating to each of the 265 X (Expanded) Industries based on their average Zacks Rank.
An industry with a larger percentage of Zacks Rank #1's and #2's will have a better average Zacks Rank than one with a larger percentage of Zacks Rank #4's and #5's.
The industry with the best average Zacks Rank would be considered the top industry (1 out of 265), which would place it in the top 1% of Zacks Ranked Industries. The industry with the worst average Zacks Rank (265 out of 265) would place in the bottom 1%.
The Zacks Sector Rank assigns a rating to each of the 16 Sectors based on their average Zacks Rank.
A sector with a larger percentage of Zacks Rank #1's and #2's will have a better average Zacks Rank than one with a larger percentage of Zacks Rank #4's and #5's.
The sector with the best average Zacks Rank would be considered the top sector (1 out of 16), which would place it in the top 1% of Zacks Ranked Sectors. The sector with the worst average Zacks Rank (16 out of 16) would place in the bottom 1%.
The Style Scores are a complementary set of indicators to use alongside the Zacks Rank. It allows the user to better focus on the stocks that are the best fit for his or her personal trading style.
The scores are based on the trading styles of Value, Growth, and Momentum. There's also a VGM Score ('V' for Value, 'G' for Growth and 'M' for Momentum), which combines the weighted average of the individual style scores into one score.
Value ScoreA
Growth ScoreA
Momentum ScoreA
VGM ScoreA
Within each Score, stocks are graded into five groups: A, B, C, D and F. As you might remember from your school days, an A, is better than a B; a B is better than a C; a C is better than a D; and a D is better than an F.
As an investor, you want to buy stocks with the highest probability of success. That means you want to buy stocks with a Zacks Rank #1 or #2, Strong Buy or Buy, which also has a Score of an A or a B in your personal trading style.
Zacks Earnings ESP (Expected Surprise Prediction) looks to find companies that have recently seen positive earnings estimate revision activity. The idea is that more recent information is, generally speaking, more accurate and can be a better predictor of the future, which can give investors an advantage in earnings season.
The technique has proven to be very useful for finding positive surprises. In fact, when combining a Zacks Rank #3 or better and a positive Earnings ESP, stocks produced a positive surprise 70% of the time, while they also saw 28.3% annual returns on average, according to our 10 year backtest.
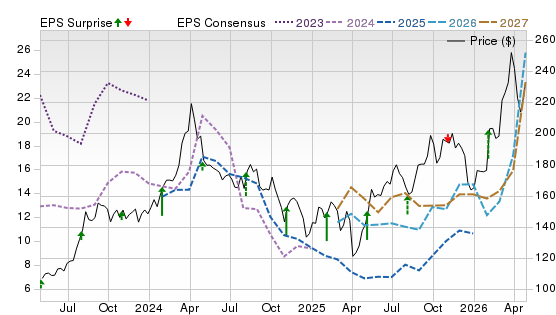
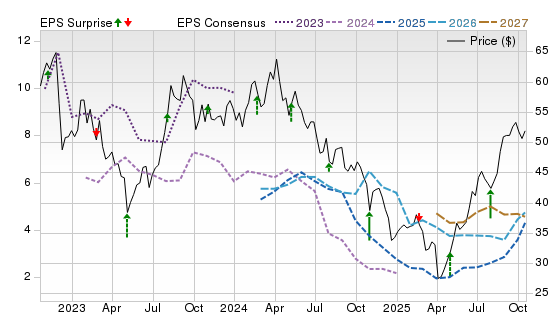
HF Sinclair is a U.S. independent refiner with renewables, lubricants, and branded marketing exposure that can diversify crack-spread cycles. Momentum improved into 2026 as management expanded its Rockies/Southwest retail footprint through a branded marketing joint venture and continued to scale Lubricants & Specialties with tuck-in acquisitions. The latest quarter underscored operating leverage when margins and renewable credit economics cooperate, supporting cash returns.
Potential Risks
Refining is cyclical and can reverse quickly if demand softens or crude differentials move against it. Policy shifts tied to low-carbon fuels or renewable tax credits could also reset expectations.
Forecast
A Zacks Rank #1 (Strong Buy) with Style Scores of A for Value, B for Growth, and A for Momentum suggests revisions and price action are aligned. The chart shows a strong 2026 price rebound, while 2026-2027 EPS consensus stair-stepping higher with more recent beats, supporting further upward revisions if spreads and credits hold.
This is our short term rating system that serves as a timeliness indicator for stocks over the next 1 to 3 months. How good is it? See rankings and related performance below.
The Zacks Industry Rank assigns a rating to each of the 265 X (Expanded) Industries based on their average Zacks Rank.
An industry with a larger percentage of Zacks Rank #1's and #2's will have a better average Zacks Rank than one with a larger percentage of Zacks Rank #4's and #5's.
The industry with the best average Zacks Rank would be considered the top industry (1 out of 265), which would place it in the top 1% of Zacks Ranked Industries. The industry with the worst average Zacks Rank (265 out of 265) would place in the bottom 1%.
The Zacks Sector Rank assigns a rating to each of the 16 Sectors based on their average Zacks Rank.
A sector with a larger percentage of Zacks Rank #1's and #2's will have a better average Zacks Rank than one with a larger percentage of Zacks Rank #4's and #5's.
The sector with the best average Zacks Rank would be considered the top sector (1 out of 16), which would place it in the top 1% of Zacks Ranked Sectors. The sector with the worst average Zacks Rank (16 out of 16) would place in the bottom 1%.
The Style Scores are a complementary set of indicators to use alongside the Zacks Rank. It allows the user to better focus on the stocks that are the best fit for his or her personal trading style.
The scores are based on the trading styles of Value, Growth, and Momentum. There's also a VGM Score ('V' for Value, 'G' for Growth and 'M' for Momentum), which combines the weighted average of the individual style scores into one score.
Value ScoreA
Growth ScoreA
Momentum ScoreA
VGM ScoreA
Within each Score, stocks are graded into five groups: A, B, C, D and F. As you might remember from your school days, an A, is better than a B; a B is better than a C; a C is better than a D; and a D is better than an F.
As an investor, you want to buy stocks with the highest probability of success. That means you want to buy stocks with a Zacks Rank #1 or #2, Strong Buy or Buy, which also has a Score of an A or a B in your personal trading style.
Zacks Earnings ESP (Expected Surprise Prediction) looks to find companies that have recently seen positive earnings estimate revision activity. The idea is that more recent information is, generally speaking, more accurate and can be a better predictor of the future, which can give investors an advantage in earnings season.
The technique has proven to be very useful for finding positive surprises. In fact, when combining a Zacks Rank #3 or better and a positive Earnings ESP, stocks produced a positive surprise 70% of the time, while they also saw 28.3% annual returns on average, according to our 10 year backtest.
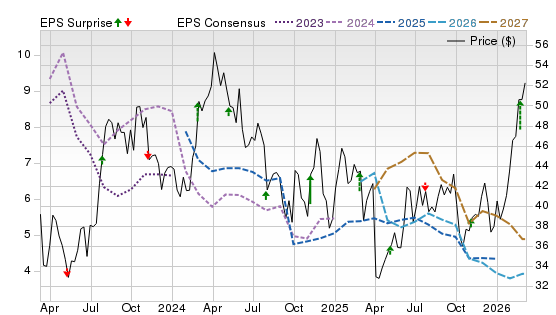
Marathon Petroleum is a top U.S. refiner with midstream exposure via MPLX, pairing cyclic crack-spread upside with steadier fee-based cash flows. Through 2026, MPC has kept returning capital while funding high-return projects, including jet-fuel flexibility upgrades, and has pointed to MPLX’s Permian buildout, which can lift distributions to MPC in 2026 and 2027. The latest quarter showed the model holding up even amid heavy turnaround activity.
Potential Risks
Turnarounds and upgrades can pressure costs and utilization, and results remain highly sensitive to crack spreads and hedging outcomes. Environmental remediation and clean-fuel credit policy shifts can also weigh on earnings.
Forecast
Zacks Rank #1, with B scores for Value, Growth, and Momentum, points to favorable revisions across balanced factors. The chart shows price pushing to new 2026 highs as 2026-2027 EPS consensus moving higher, alongside recent beats, supporting more upward tweaks if utilization stays strong.
This is our short term rating system that serves as a timeliness indicator for stocks over the next 1 to 3 months. How good is it? See rankings and related performance below.
The Zacks Industry Rank assigns a rating to each of the 265 X (Expanded) Industries based on their average Zacks Rank.
An industry with a larger percentage of Zacks Rank #1's and #2's will have a better average Zacks Rank than one with a larger percentage of Zacks Rank #4's and #5's.
The industry with the best average Zacks Rank would be considered the top industry (1 out of 265), which would place it in the top 1% of Zacks Ranked Industries. The industry with the worst average Zacks Rank (265 out of 265) would place in the bottom 1%.
The Zacks Sector Rank assigns a rating to each of the 16 Sectors based on their average Zacks Rank.
A sector with a larger percentage of Zacks Rank #1's and #2's will have a better average Zacks Rank than one with a larger percentage of Zacks Rank #4's and #5's.
The sector with the best average Zacks Rank would be considered the top sector (1 out of 16), which would place it in the top 1% of Zacks Ranked Sectors. The sector with the worst average Zacks Rank (16 out of 16) would place in the bottom 1%.
The Style Scores are a complementary set of indicators to use alongside the Zacks Rank. It allows the user to better focus on the stocks that are the best fit for his or her personal trading style.
The scores are based on the trading styles of Value, Growth, and Momentum. There's also a VGM Score ('V' for Value, 'G' for Growth and 'M' for Momentum), which combines the weighted average of the individual style scores into one score.
Value ScoreA
Growth ScoreA
Momentum ScoreA
VGM ScoreA
Within each Score, stocks are graded into five groups: A, B, C, D and F. As you might remember from your school days, an A, is better than a B; a B is better than a C; a C is better than a D; and a D is better than an F.
As an investor, you want to buy stocks with the highest probability of success. That means you want to buy stocks with a Zacks Rank #1 or #2, Strong Buy or Buy, which also has a Score of an A or a B in your personal trading style.
Zacks Earnings ESP (Expected Surprise Prediction) looks to find companies that have recently seen positive earnings estimate revision activity. The idea is that more recent information is, generally speaking, more accurate and can be a better predictor of the future, which can give investors an advantage in earnings season.
The technique has proven to be very useful for finding positive surprises. In fact, when combining a Zacks Rank #3 or better and a positive Earnings ESP, stocks produced a positive surprise 70% of the time, while they also saw 28.3% annual returns on average, according to our 10 year backtest.
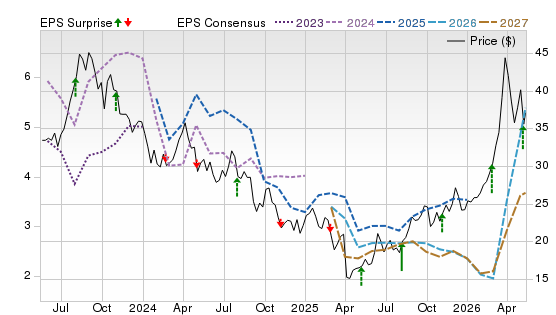
Ovintiv is an oil-and-gas E&P with U.S. shale liquids and Canadian gas exposure, giving it torque to commodity rebounds and efficiency gains. Q1 2026 results highlighted operating efficiency: production was 679 MBOE/d at the high end of guidance, capital investment was at the low end, and cash from operations was $1.1 billion. That cash-generation profile can support returns when execution stays tight.
Potential Risks
The business is highly sensitive to oil and gas prices, basis differentials, and macro shocks, while Q1’s ceiling-test impairment highlighted non-cash charge risk. Well variability, service-cost inflation, and U.S.-Canada trade frictions may pressure performance.
Forecast
A Zacks Rank #1 with Value B, Growth C, and Momentum A scores implies revisions are positive, but growth expectations are cautious. The chart shows a sharp 2026 price surge and 2026-2027 EPS consensus edging higher, with recent beats outnumbering misses, suggesting room for upward revisions if commodities cooperate.
This is our short term rating system that serves as a timeliness indicator for stocks over the next 1 to 3 months. How good is it? See rankings and related performance below.
The Zacks Industry Rank assigns a rating to each of the 265 X (Expanded) Industries based on their average Zacks Rank.
An industry with a larger percentage of Zacks Rank #1's and #2's will have a better average Zacks Rank than one with a larger percentage of Zacks Rank #4's and #5's.
The industry with the best average Zacks Rank would be considered the top industry (1 out of 265), which would place it in the top 1% of Zacks Ranked Industries. The industry with the worst average Zacks Rank (265 out of 265) would place in the bottom 1%.
The Zacks Sector Rank assigns a rating to each of the 16 Sectors based on their average Zacks Rank.
A sector with a larger percentage of Zacks Rank #1's and #2's will have a better average Zacks Rank than one with a larger percentage of Zacks Rank #4's and #5's.
The sector with the best average Zacks Rank would be considered the top sector (1 out of 16), which would place it in the top 1% of Zacks Ranked Sectors. The sector with the worst average Zacks Rank (16 out of 16) would place in the bottom 1%.
The Style Scores are a complementary set of indicators to use alongside the Zacks Rank. It allows the user to better focus on the stocks that are the best fit for his or her personal trading style.
The scores are based on the trading styles of Value, Growth, and Momentum. There's also a VGM Score ('V' for Value, 'G' for Growth and 'M' for Momentum), which combines the weighted average of the individual style scores into one score.
Value ScoreA
Growth ScoreA
Momentum ScoreA
VGM ScoreA
Within each Score, stocks are graded into five groups: A, B, C, D and F. As you might remember from your school days, an A, is better than a B; a B is better than a C; a C is better than a D; and a D is better than an F.
As an investor, you want to buy stocks with the highest probability of success. That means you want to buy stocks with a Zacks Rank #1 or #2, Strong Buy or Buy, which also has a Score of an A or a B in your personal trading style.
Zacks Earnings ESP (Expected Surprise Prediction) looks to find companies that have recently seen positive earnings estimate revision activity. The idea is that more recent information is, generally speaking, more accurate and can be a better predictor of the future, which can give investors an advantage in earnings season.
The technique has proven to be very useful for finding positive surprises. In fact, when combining a Zacks Rank #3 or better and a positive Earnings ESP, stocks produced a positive surprise 70% of the time, while they also saw 28.3% annual returns on average, according to our 10 year backtest.
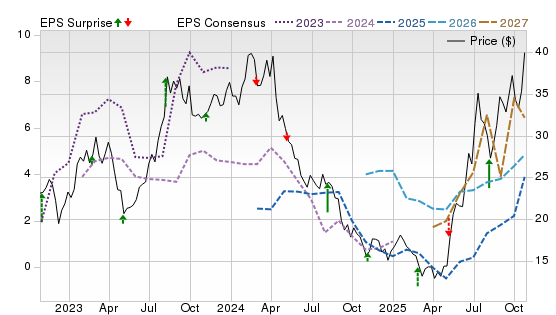
APA is a global upstream producer with exposure to U.S. Permian oil and Egyptian gas. The latest quarter showed operational upside, with U.S. oil production beating guidance on efficiency and uptime. It also raised its full-year U.S. oil outlook without lifting Permian capital, underscoring discipline. Management is executing a cost-reduction program targeting $450 million of run-rate savings by year-end 2026 and has been paying down near-term maturities, lowering expected interest expense.
Potential Risks
International operations add geopolitical and fiscal risk, especially under Egypt’s production-sharing terms. Portfolio complexity can absorb capital, and weaker oil or gas prices would squeeze free cash flow and slow deleveraging.
Forecast
Zacks Rank #1 with Value A, Growth C, and Momentum C scores signals favorable revisions without a strong factor tailwind. The chart shows price bottoming in 2025 then rebounding in 2026 as 2026-2027 EPS consensus edges higher, with a recent tilt toward beats that can sustain upward revisions if execution holds.
This is our short term rating system that serves as a timeliness indicator for stocks over the next 1 to 3 months. How good is it? See rankings and related performance below.
The Zacks Industry Rank assigns a rating to each of the 265 X (Expanded) Industries based on their average Zacks Rank.
An industry with a larger percentage of Zacks Rank #1's and #2's will have a better average Zacks Rank than one with a larger percentage of Zacks Rank #4's and #5's.
The industry with the best average Zacks Rank would be considered the top industry (1 out of 265), which would place it in the top 1% of Zacks Ranked Industries. The industry with the worst average Zacks Rank (265 out of 265) would place in the bottom 1%.
The Zacks Sector Rank assigns a rating to each of the 16 Sectors based on their average Zacks Rank.
A sector with a larger percentage of Zacks Rank #1's and #2's will have a better average Zacks Rank than one with a larger percentage of Zacks Rank #4's and #5's.
The sector with the best average Zacks Rank would be considered the top sector (1 out of 16), which would place it in the top 1% of Zacks Ranked Sectors. The sector with the worst average Zacks Rank (16 out of 16) would place in the bottom 1%.
The Style Scores are a complementary set of indicators to use alongside the Zacks Rank. It allows the user to better focus on the stocks that are the best fit for his or her personal trading style.
The scores are based on the trading styles of Value, Growth, and Momentum. There's also a VGM Score ('V' for Value, 'G' for Growth and 'M' for Momentum), which combines the weighted average of the individual style scores into one score.
Value ScoreA
Growth ScoreA
Momentum ScoreA
VGM ScoreA
Within each Score, stocks are graded into five groups: A, B, C, D and F. As you might remember from your school days, an A, is better than a B; a B is better than a C; a C is better than a D; and a D is better than an F.
As an investor, you want to buy stocks with the highest probability of success. That means you want to buy stocks with a Zacks Rank #1 or #2, Strong Buy or Buy, which also has a Score of an A or a B in your personal trading style.
Zacks Earnings ESP (Expected Surprise Prediction) looks to find companies that have recently seen positive earnings estimate revision activity. The idea is that more recent information is, generally speaking, more accurate and can be a better predictor of the future, which can give investors an advantage in earnings season.
The technique has proven to be very useful for finding positive surprises. In fact, when combining a Zacks Rank #3 or better and a positive Earnings ESP, stocks produced a positive surprise 70% of the time, while they also saw 28.3% annual returns on average, according to our 10 year backtest.
Par Pacific is a niche refiner and marketer concentrated in Hawaii and the U.S. West Coast, with expanding low-carbon fuels exposure through its Hawaii Renewables project. In the latest reported quarter, the company delivered a profit on an adjusted basis and solid liquidity, supporting buybacks and the renewables ramp. Hawaii throughput and improved margins lifted Adjusted EBITDA well above the prior year. Commercial startup of the Hawaii renewable fuels facility in April adds upside as renewable diesel and SAF validation advances.
Potential Risks
Profitability can reverse quickly if margins narrow, price-lag pressures rise, or outages occur. Renewables carry execution and credit-policy risks, while Hawaii’s supply chain heightens disruption exposure.
Forecast
Zacks Rank #1 with Value A, but Growth D and Momentum D scores signal cheapness without strong factor support. The chart shows a 2026 price breakout alongside a steep rise in 2026-2027 EPS consensus and improving surprise marks, but the bar is rising.
The Zacks Rank is a proprietary stock-rating model that uses trends in earnings estimate revisions and earnings-per-share (EPS) surprises to classify stocks into five groups: #1 (Strong Buy), #2 (Buy), #3 (Hold), #4 (Sell) and #5 (Strong Sell). The Zacks Rank is calculated through four primary factors related to earnings estimates: analysts' consensus on earnings estimate revisions, the magnitude of revision change, the upside potential and estimate surprise (or the degree in which earnings per share deviated from the previous quarter).
Zacks builds the data from 3,000 analysts at over 150 different brokerage firms. The average yearly gain for Zacks Rank #1 (Strong Buy) stocks is +23.62% per year from January, 1988, through June 2, 2025.
Selections for Best Biotech Stocks are based on the current top ranking stocks based on Zacks Indicator Score, Style Scores and fundamentals. For this list, only companies that have average daily trading volumes of 100,000 shares or more of 95 energy companies listed on the New York Stock Exchange or Nasdaq. All information is current as of market open, May 20, 2026.
General Questions About Energy Stocks
Types of energy stocks
Energy equities are diverse, spanning traditional oil and gas functions to electrification and renewable power. Below are the major categories with representative companies to help you understand where stocks fit in the broader sector.
Integrated producers
These are large energy companies involved in the full value chain—from finding and producing oil and gas (upstream), transporting it (midstream), refining it into fuels (downstream), and often selling it at retail. This breadth can help smooth earnings when one segment underperforms.
Examples:
Exxon Mobil (XOM): One of the world’s largest integrated oil majors with operations across exploration, refining, petrochemicals and emerging low-carbon solutions.
Chevron (CVX): Another U.S. supermajor with a globally diversified portfolio of upstream and downstream assets.
BP plc (BP): UK-based integrated energy company with oil/gas and growing renewable investments.
Shell plc (SHEL): Major European integrated producer also building out renewables and LNG infrastructure.
Exploration & Production (E&P)
Companies in this group focus chiefly on finding and drilling for crude oil and natural gas. Their earnings often move in step with commodity prices because they sell raw energy products.
Examples:
ConocoPhillips (COP): A large independent producer with strong positions in U.S. shale and global fields.
EQT Corporation (EQT): One of the biggest natural gas producers in the U.S., with deep Marcellus Basin exposure.
Diamondback Energy (FANG): Focused on shale oil production in the Permian Basin.
Civitas Resources (CIVI), Chord Energy (CHRD), Vista Energy (VIST): Examples of smaller/mid-cap E&Ps with exploration upside.
Midstream Pipelines
Midstream firms own and operate the infrastructure that moves and stores oil, natural gas, and related products. Their earnings tend to come from fee-based contracts rather than commodity prices, offering stability.
Examples:
Enbridge Inc. (ENB): A Canadian giant operating one of North America’s largest pipeline networks for crude and natural gas.
Kinder Morgan (KMI): Major U.S. pipeline owner transporting hydrocarbons and refined products.
Enterprise Products Partners (EPD): One of the largest midstream master limited partnerships (MLPs) with thousands of miles of pipelines.
MPLX (MPLX): A high-yield midstream MLP spun out of Marathon Petroleum.
ONEOK (OKE): Midstream operator handling natural gas liquids and pipelines across the U.S.
Refiners
Refining companies take crude oil and transform it into usable products like gasoline, diesel, jet fuel, and petrochemicals. These stocks often do well when refining margins (crack spreads) are wide
Examples:
Phillips 66 (PSX): A leading U.S. refiner also expanding into midstream infrastructure.
Valero Energy (VLO): One of the largest independent refiners with global footprint.
Marathon Petroleum (MPC): Large U.S. refiner with affiliated midstream operations.
Utilities
Utilities generate and deliver electricity or natural gas to consumers and businesses. These firms are typically more regulated and less volatile than pure commodity plays. Many are also transitioning to cleaner energy sources.
Examples:
NextEra Energy (NEE): Largest U.S. utility with a major renewable generation portfolio.
Duke Energy (DUK): Large diversified utility serving millions of customers.
Southern Company (SO): Major southeastern U.S. utility investing in grid modernization and cleaner power.
Portland General Electric (POR): Regional utility with a growing renewable footprint.
Constellation Energy (CEG): Nuclear-focused power generator with natural gas and geothermal exposure.
Renewables
These stocks focus on energy generation from sustainable sources like wind, solar, hydro, geothermal, and emerging technologies such as hydrogen and wave power. They may also include service providers in the clean-energy infrastructure space.
Examples:
Brookfield Renewable Partners (BEP): Operates an extensive portfolio of wind, solar, and hydro assets globally.
Ormat Technologies (ORA): Specialized in geothermal and solar power projects.
SolarEdge (SEDG), First Solar (FSLR), Canadian Solar (CSIQ): Growing names in solar generation and component manufacturing.
Eco Wave Power (WAVE): Early-stage wave energy technology company with high growth potential.
Quanta Services (PWR): Not a pure renewable but a key player in building and maintaining power grids and clean infrastructure.
Quick takeaway for Energy Stock Investing:
Traditional energy investors often favor integrated producers and E&Ps for commodity exposure and dividends.
Income-oriented investors may like midstream pipelines and utilities.
Growth-focused strategies commonly target renewable energy and infrastructure names.
What are the benefits of buying energy stocks?
High dividend yields relative to the broader market.
Strong correlation to inflation and commodity cycles.
Global demand for oil, natural gas, and power remains durable.
Capital-return programs (buybacks, dividends) have strengthened in recent years.
What are the risks of buying energy stocks?
Volatile crude and natural-gas prices.
Political/regulatory risk.
High capital requirements.
Demand destruction during recessions.
Technological disruption from clean-energy alternatives.
Energy Stocks vs. Energy ETFs
Stocks offer targeted exposure and potential for outsized gains if you pick winners.
ETFs provide diversification across subsectors, reducing company-specific risk.
Top Energy ETFs to Invest In
ETFs provide diversified exposure across oil producers, refiners, pipelines, and renewable-energy companies. Popular examples include:
Energy Select Sector SPDR Fund (XLE) — Tracks major S&P 500 energy giants.
Vanguard Energy ETF (VDE) — Broader basket of U.S. energy stocks.
iShares Global Clean Energy ETF (ICLN) — Focused on solar, wind, and green-tech names.
Alerian MLP ETF (AMLP) — Concentrates on income-heavy pipeline operators.
Investment Strategy & Suitability
Are dividend-paying energy stocks a good investment?
Yes—many investors favor energy companies for their historically strong dividends, supported by robust free-cash-flow generation and capital discipline.
Are energy stocks a good hedge against inflation?
Often. Oil and gas prices typically rise when inflation climbs, and producers can benefit from commodity-linked revenues.
How do energy stocks perform during a recession?
They tend to soften as fuel demand falls, though stable-cash-flow midstream operators and utilities often hold up better.
What energy stocks should I hold long-term?
Integrated majors, high-quality pipelines, regulated utilities, and established renewable developers tend to offer durable long-term returns.
Should I invest in traditional or renewable energy?
A balanced approach works for many investors: traditional companies provide cash stability, while renewables offer long-term growth potential.
How to Select Energy Stocks
When evaluating energy names, consider:
Balance-sheet strength: Favor companies with low debt, strong cash flow, and solid liquidity to withstand commodity volatility.
Capital-allocation strategy: Look for disciplined spending, smart investment priorities, and a clear plan for shareholder returns.
Dividend sustainability: Choose firms with stable cash generation, reasonable payout ratios, and reliable long-term dividend policies.
Exposure to favorable regions: Companies operating in high-productivity, low-cost areas (e.g., Permian Basin, LNG export hubs) often deliver stronger margins.
Production cost per barrel: Low-cost producers are more resilient when oil and gas prices fall and typically outperform over time.
Growth pipeline: Evaluate upcoming projects—such as renewable buildouts, LNG expansions, or refinery upgrades—that support future earnings.
Historical returns on capital: Consistently strong ROIC signals efficient management and durable value creation.
Energy Stock Trends and Market Factors
How are energy stocks affected by oil prices?
Oil prices remain the most influential variable. Producers benefit from rising crude, while refiners perform best when input costs are low and demand is strong.
What’s the forecast for the energy sector?
Analysts expect continued capital discipline, stable dividends, and a multi-year growth cycle in LNG exports. Renewables should gain momentum as financing conditions improve and global clean-energy spending rises.
How do rising interest rates impact energy stocks?
Higher rates increase borrowing costs, which can slow renewable-energy development. For oil producers, the impact is milder due to strong cash positions.
What are analysts saying about the energy market?
Most major research firms see a balanced oil market, steady global demand growth, and favorable long-term trends for both LNG and low-carbon technologies. Volatility may remain elevated, but the sector’s valuation and cash-return profile remain attractive relative to the S&P 500.


 Strong Buy