We use cookies to understand how you use our site and to improve your experience.
This includes personalizing content and advertising.
By pressing "Accept All" or closing out of this banner, you consent to the use of all cookies and similar technologies and the sharing of information they collect with third parties.
You can reject marketing cookies by pressing "Deny Optional," but we still use essential, performance, and functional cookies.
In addition, whether you "Accept All," Deny Optional," click the X or otherwise continue to use the site, you accept our Privacy Policy and Terms of Service, revised from time to time.
You are being directed to ZacksTrade, a division of LBMZ Securities and licensed broker-dealer. ZacksTrade and Zacks.com are separate companies. The web link between the two companies is not a solicitation or offer to invest in a particular security or type of security. ZacksTrade does not endorse or adopt any particular investment strategy, any analyst opinion/rating/report or any approach to evaluating individual securities.
If you wish to go to ZacksTrade, click OK. If you do not, click Cancel.
Global military spending recently climbed to record levels, led by the United States, Europe and Asia.
Defense stocks, backed by longterm government contracts, can offer relatively stable revenue streams.
Some of the best defense stocks to buy now include Axon Enterprise, Woodward and ATI.
With geopolitical tensions on the rise and defense budgets growing worldwide, aerospace and defense companies are increasingly on investors’ radars. Global military spending recently climbed to record levels, led by the United States, Europe, and key Asia Pacific nations, as governments modernize capabilities across air, sea, cyber and space. From traditional prime contractors to next-generation space systems developers, the defense sector offers a range of opportunities with different risk-reward profiles.
Below you will find a comprehensive look at the best defense stocks, how they behave across market cycles, and strategies for incorporating them into a portfolio.
Are defense stocks a good investment?
Defense firms often operate in oligopolistic markets, backed by long-term government contracts and multiyear procurement programs. This can translate into relatively stable revenue streams compared with purely commercial businesses, especially during economic slowdowns when federal spending tends to be more predictable than consumer demand.
Examples of leading public defense companies:
Lockheed Martin Corporation (LMT) – A top U.S. prime contractor on fighter jets, missiles, and advanced defense systems.
RTX Corporation (RTX) – Parent of Raytheon Technologies with strong positions in missile defense and avionics.
Northrop Grumman Corporation (NOC) – Major systems integrator known for stealth bombers and space systems.
General Dynamics Corporation (GD) – Builds combat vehicles, submarines, and defense electronics.
Boeing Company (BA) – Aerospace and defense manufacturer with significant military contracts.
Intuitive Machines, Inc. (LUNR) – Emerging space technology and services company working with NASA and U.S. national security space programs.
These names represent different segments — from legacy primes to newer space-oriented contractors.
Do defense stocks outperform the market?
Historically, defense equities have:
Delivered competitive long-term returns versus broad indexes like the S&P 500.
Shown resilience during geopolitical shocks when investors rotate toward “stable” government-linked revenue streams.
Benefited from increased defense appropriations and supplemental spending bills.
Still, performance varies by company and period.
Below, we analyze and rank the best defense stocks using a blend of Zacks Rank signals, Style Scores, and fundamental metrics to identify compelling opportunities in today’s market.
This is our short term rating system that serves as a timeliness indicator for stocks over the next 1 to 3 months. How good is it? See rankings and related performance below.
The Zacks Industry Rank assigns a rating to each of the 265 X (Expanded) Industries based on their average Zacks Rank.
An industry with a larger percentage of Zacks Rank #1's and #2's will have a better average Zacks Rank than one with a larger percentage of Zacks Rank #4's and #5's.
The industry with the best average Zacks Rank would be considered the top industry (1 out of 265), which would place it in the top 1% of Zacks Ranked Industries. The industry with the worst average Zacks Rank (265 out of 265) would place in the bottom 1%.
The Zacks Sector Rank assigns a rating to each of the 16 Sectors based on their average Zacks Rank.
A sector with a larger percentage of Zacks Rank #1's and #2's will have a better average Zacks Rank than one with a larger percentage of Zacks Rank #4's and #5's.
The sector with the best average Zacks Rank would be considered the top sector (1 out of 16), which would place it in the top 1% of Zacks Ranked Sectors. The sector with the worst average Zacks Rank (16 out of 16) would place in the bottom 1%.
The Style Scores are a complementary set of indicators to use alongside the Zacks Rank. It allows the user to better focus on the stocks that are the best fit for his or her personal trading style.
The scores are based on the trading styles of Value, Growth, and Momentum. There's also a VGM Score ('V' for Value, 'G' for Growth and 'M' for Momentum), which combines the weighted average of the individual style scores into one score.
Value ScoreA
Growth ScoreA
Momentum ScoreA
VGM ScoreA
Within each Score, stocks are graded into five groups: A, B, C, D and F. As you might remember from your school days, an A, is better than a B; a B is better than a C; a C is better than a D; and a D is better than an F.
As an investor, you want to buy stocks with the highest probability of success. That means you want to buy stocks with a Zacks Rank #1 or #2, Strong Buy or Buy, which also has a Score of an A or a B in your personal trading style.
Zacks Earnings ESP (Expected Surprise Prediction) looks to find companies that have recently seen positive earnings estimate revision activity. The idea is that more recent information is, generally speaking, more accurate and can be a better predictor of the future, which can give investors an advantage in earnings season.
The technique has proven to be very useful for finding positive surprises. In fact, when combining a Zacks Rank #3 or better and a positive Earnings ESP, stocks produced a positive surprise 70% of the time, while they also saw 28.3% annual returns on average, according to our 10 year backtest.
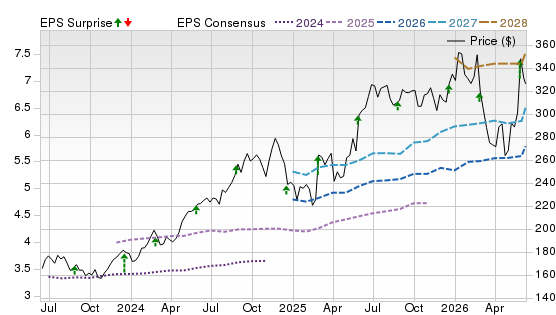
Axon builds connected public-safety and defense-adjacent platforms across TASER, cameras, cloud software, AI, 911, Fusus and Dedrone. Its integrated sensor-to-software ecosystem should benefit as agencies adopt AI-era workflows, real-time operations and counter-drone infrastructure. Management expects rapid AI adoption, broader international demand and Dedrone-led opportunities across public safety, enterprise, federal and international markets to support long-term growth and margin discipline ahead.
Potential Risks
Risks include geopolitical and supply-chain disruptions, tariffs, memory-cost inflation, lower-margin platform-solutions mix, acquisition-integration demands and hardware-scaling constraints in counter-drone deployments.
Forecast
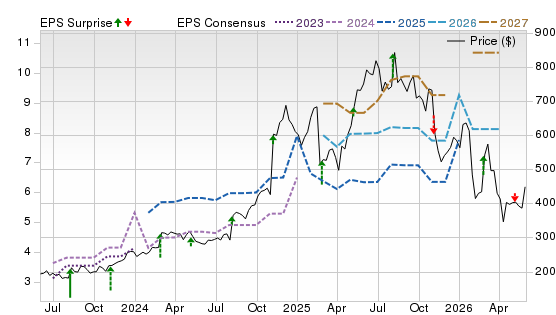
A Zacks Rank #1 (Strong Buy) signals favorable estimate momentum, though Style Scores of F for Value and Growth show valuation and growth metrics are stretched, while C Momentum is steadier. The chart shows price volatility after a spike, but 2026–2027 consensus lines remain well above 2025, with mostly positive surprises supporting the bullish revision story.
This is our short term rating system that serves as a timeliness indicator for stocks over the next 1 to 3 months. How good is it? See rankings and related performance below.
The Zacks Industry Rank assigns a rating to each of the 265 X (Expanded) Industries based on their average Zacks Rank.
An industry with a larger percentage of Zacks Rank #1's and #2's will have a better average Zacks Rank than one with a larger percentage of Zacks Rank #4's and #5's.
The industry with the best average Zacks Rank would be considered the top industry (1 out of 265), which would place it in the top 1% of Zacks Ranked Industries. The industry with the worst average Zacks Rank (265 out of 265) would place in the bottom 1%.
The Zacks Sector Rank assigns a rating to each of the 16 Sectors based on their average Zacks Rank.
A sector with a larger percentage of Zacks Rank #1's and #2's will have a better average Zacks Rank than one with a larger percentage of Zacks Rank #4's and #5's.
The sector with the best average Zacks Rank would be considered the top sector (1 out of 16), which would place it in the top 1% of Zacks Ranked Sectors. The sector with the worst average Zacks Rank (16 out of 16) would place in the bottom 1%.
The Style Scores are a complementary set of indicators to use alongside the Zacks Rank. It allows the user to better focus on the stocks that are the best fit for his or her personal trading style.
The scores are based on the trading styles of Value, Growth, and Momentum. There's also a VGM Score ('V' for Value, 'G' for Growth and 'M' for Momentum), which combines the weighted average of the individual style scores into one score.
Value ScoreA
Growth ScoreA
Momentum ScoreA
VGM ScoreA
Within each Score, stocks are graded into five groups: A, B, C, D and F. As you might remember from your school days, an A, is better than a B; a B is better than a C; a C is better than a D; and a D is better than an F.
As an investor, you want to buy stocks with the highest probability of success. That means you want to buy stocks with a Zacks Rank #1 or #2, Strong Buy or Buy, which also has a Score of an A or a B in your personal trading style.
Zacks Earnings ESP (Expected Surprise Prediction) looks to find companies that have recently seen positive earnings estimate revision activity. The idea is that more recent information is, generally speaking, more accurate and can be a better predictor of the future, which can give investors an advantage in earnings season.
The technique has proven to be very useful for finding positive surprises. In fact, when combining a Zacks Rank #3 or better and a positive Earnings ESP, stocks produced a positive surprise 70% of the time, while they also saw 28.3% annual returns on average, according to our 10 year backtest.
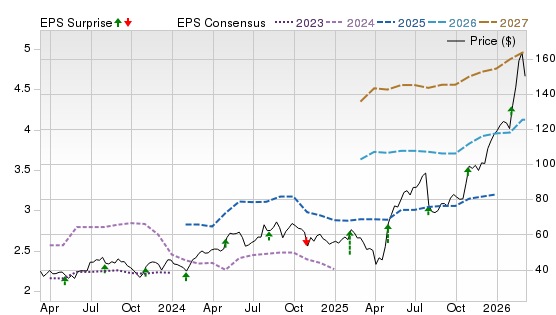
HEICO supplies aerospace replacement parts, repair and overhaul services and specialized electronic components for defense, space and aerospace uses. Firm backlog across FSG and ETG should support future sales conversion, while recent buys broaden defense exposure through military aircraft fuel containment, defense engine repair, mission-critical avionics maintenance and rugged antennas for defense and law enforcement applications, further reinforcing acquisition-driven growth prospects ahead.
Potential Risks
Risks include reduced defense, space or homeland-security spending, export restrictions, manufacturing difficulties, lower commercial air travel, acquisition approval or synergy shortfalls, customer credit, interest rates, inflation, competition pressures.
Forecast
A Zacks Rank #1 reinforces strong earnings-revision momentum, while F Value, C for Growth and Momentum imply quality is already well recognized. The chart shows a long price uptrend with periodic pullbacks, rising 2026–2027 estimates and frequent positive surprises, suggesting analysts continue to reward steady execution despite valuation risk.
This is our short term rating system that serves as a timeliness indicator for stocks over the next 1 to 3 months. How good is it? See rankings and related performance below.
The Zacks Industry Rank assigns a rating to each of the 265 X (Expanded) Industries based on their average Zacks Rank.
An industry with a larger percentage of Zacks Rank #1's and #2's will have a better average Zacks Rank than one with a larger percentage of Zacks Rank #4's and #5's.
The industry with the best average Zacks Rank would be considered the top industry (1 out of 265), which would place it in the top 1% of Zacks Ranked Industries. The industry with the worst average Zacks Rank (265 out of 265) would place in the bottom 1%.
The Zacks Sector Rank assigns a rating to each of the 16 Sectors based on their average Zacks Rank.
A sector with a larger percentage of Zacks Rank #1's and #2's will have a better average Zacks Rank than one with a larger percentage of Zacks Rank #4's and #5's.
The sector with the best average Zacks Rank would be considered the top sector (1 out of 16), which would place it in the top 1% of Zacks Ranked Sectors. The sector with the worst average Zacks Rank (16 out of 16) would place in the bottom 1%.
The Style Scores are a complementary set of indicators to use alongside the Zacks Rank. It allows the user to better focus on the stocks that are the best fit for his or her personal trading style.
The scores are based on the trading styles of Value, Growth, and Momentum. There's also a VGM Score ('V' for Value, 'G' for Growth and 'M' for Momentum), which combines the weighted average of the individual style scores into one score.
Value ScoreA
Growth ScoreA
Momentum ScoreA
VGM ScoreA
Within each Score, stocks are graded into five groups: A, B, C, D and F. As you might remember from your school days, an A, is better than a B; a B is better than a C; a C is better than a D; and a D is better than an F.
As an investor, you want to buy stocks with the highest probability of success. That means you want to buy stocks with a Zacks Rank #1 or #2, Strong Buy or Buy, which also has a Score of an A or a B in your personal trading style.
Zacks Earnings ESP (Expected Surprise Prediction) looks to find companies that have recently seen positive earnings estimate revision activity. The idea is that more recent information is, generally speaking, more accurate and can be a better predictor of the future, which can give investors an advantage in earnings season.
The technique has proven to be very useful for finding positive surprises. In fact, when combining a Zacks Rank #3 or better and a positive Earnings ESP, stocks produced a positive surprise 70% of the time, while they also saw 28.3% annual returns on average, according to our 10 year backtest.
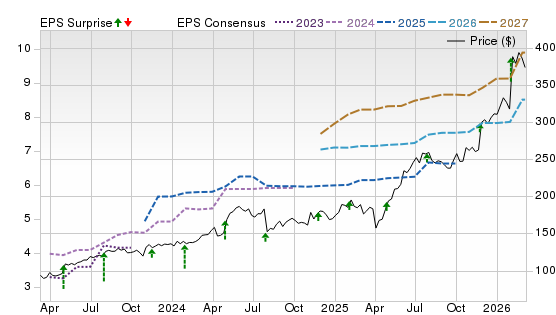
ATI supplies advanced specialty materials for demanding aerospace, defense and energy applications. Looking ahead, double-digit 2026 growth in jet engine and defense demand, an airframe recovery beginning in the second half, and specialty energy’s emergence should support core revenue growth, adjusted EBITDA expansion, free-cash-flow generation and incremental margin gains, reinforcing its appeal as a defense-linked materials play for defense investors.
Potential Risks
ATI’s outlook depends on delivering Defense and Jet Engine growth, starting the planned airframe recovery, scaling Specialty Energy, managing working-capital cash use, capital spending and 2027 debt maturities.
Forecast
A Zacks Rank #2 (Buy) is constructive, and A Growth offsets a weaker D for Value and Momentum. The chart is favorable, with the price having broken higher with 2026–2028 consensus estimates stepping up, while recent green surprise markers suggest earnings execution has rebuilt confidence after a softer stretch in 2024.
This is our short term rating system that serves as a timeliness indicator for stocks over the next 1 to 3 months. How good is it? See rankings and related performance below.
The Zacks Industry Rank assigns a rating to each of the 265 X (Expanded) Industries based on their average Zacks Rank.
An industry with a larger percentage of Zacks Rank #1's and #2's will have a better average Zacks Rank than one with a larger percentage of Zacks Rank #4's and #5's.
The industry with the best average Zacks Rank would be considered the top industry (1 out of 265), which would place it in the top 1% of Zacks Ranked Industries. The industry with the worst average Zacks Rank (265 out of 265) would place in the bottom 1%.
The Zacks Sector Rank assigns a rating to each of the 16 Sectors based on their average Zacks Rank.
A sector with a larger percentage of Zacks Rank #1's and #2's will have a better average Zacks Rank than one with a larger percentage of Zacks Rank #4's and #5's.
The sector with the best average Zacks Rank would be considered the top sector (1 out of 16), which would place it in the top 1% of Zacks Ranked Sectors. The sector with the worst average Zacks Rank (16 out of 16) would place in the bottom 1%.
The Style Scores are a complementary set of indicators to use alongside the Zacks Rank. It allows the user to better focus on the stocks that are the best fit for his or her personal trading style.
The scores are based on the trading styles of Value, Growth, and Momentum. There's also a VGM Score ('V' for Value, 'G' for Growth and 'M' for Momentum), which combines the weighted average of the individual style scores into one score.
Value ScoreA
Growth ScoreA
Momentum ScoreA
VGM ScoreA
Within each Score, stocks are graded into five groups: A, B, C, D and F. As you might remember from your school days, an A, is better than a B; a B is better than a C; a C is better than a D; and a D is better than an F.
As an investor, you want to buy stocks with the highest probability of success. That means you want to buy stocks with a Zacks Rank #1 or #2, Strong Buy or Buy, which also has a Score of an A or a B in your personal trading style.
Zacks Earnings ESP (Expected Surprise Prediction) looks to find companies that have recently seen positive earnings estimate revision activity. The idea is that more recent information is, generally speaking, more accurate and can be a better predictor of the future, which can give investors an advantage in earnings season.
The technique has proven to be very useful for finding positive surprises. In fact, when combining a Zacks Rank #3 or better and a positive Earnings ESP, stocks produced a positive surprise 70% of the time, while they also saw 28.3% annual returns on average, according to our 10 year backtest.
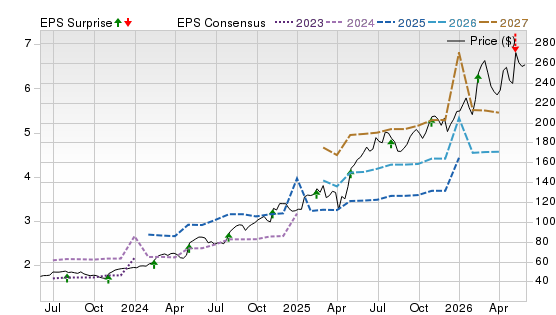
Woodward designs engineered solutions for aerospace and industrial customers, with defense embedded in its Aerospace portfolio. Demand for defense products, robust smart defense order activity, steady operations tempo and a solid services environment should keep supporting growth, while innovation and operational excellence initiatives may help sustain profitability as fiscal 2026 guidance points to stronger aerospace sales and segment margins ahead.
Potential Risks
Risks include supply-chain and labor constraints, customer concentration, long sales cycles, U.S. government contracting exposure, shifting defense spending patterns, competitive pressure and broader economic instability affecting demand visibility.
Forecast
A Zacks Rank #2 suggests positive but not top-tier estimate momentum. Style Scores of D for Value, C for Growth and F for Momentum point to a more selective setup. The chart shows a powerful price advance, rising 2026–2028 estimates and mostly positive recent surprises, but the steep slope leaves the stock vulnerable if revisions flatten.
This is our short term rating system that serves as a timeliness indicator for stocks over the next 1 to 3 months. How good is it? See rankings and related performance below.
The Zacks Industry Rank assigns a rating to each of the 265 X (Expanded) Industries based on their average Zacks Rank.
An industry with a larger percentage of Zacks Rank #1's and #2's will have a better average Zacks Rank than one with a larger percentage of Zacks Rank #4's and #5's.
The industry with the best average Zacks Rank would be considered the top industry (1 out of 265), which would place it in the top 1% of Zacks Ranked Industries. The industry with the worst average Zacks Rank (265 out of 265) would place in the bottom 1%.
The Zacks Sector Rank assigns a rating to each of the 16 Sectors based on their average Zacks Rank.
A sector with a larger percentage of Zacks Rank #1's and #2's will have a better average Zacks Rank than one with a larger percentage of Zacks Rank #4's and #5's.
The sector with the best average Zacks Rank would be considered the top sector (1 out of 16), which would place it in the top 1% of Zacks Ranked Sectors. The sector with the worst average Zacks Rank (16 out of 16) would place in the bottom 1%.
The Style Scores are a complementary set of indicators to use alongside the Zacks Rank. It allows the user to better focus on the stocks that are the best fit for his or her personal trading style.
The scores are based on the trading styles of Value, Growth, and Momentum. There's also a VGM Score ('V' for Value, 'G' for Growth and 'M' for Momentum), which combines the weighted average of the individual style scores into one score.
Value ScoreA
Growth ScoreA
Momentum ScoreA
VGM ScoreA
Within each Score, stocks are graded into five groups: A, B, C, D and F. As you might remember from your school days, an A, is better than a B; a B is better than a C; a C is better than a D; and a D is better than an F.
As an investor, you want to buy stocks with the highest probability of success. That means you want to buy stocks with a Zacks Rank #1 or #2, Strong Buy or Buy, which also has a Score of an A or a B in your personal trading style.
Zacks Earnings ESP (Expected Surprise Prediction) looks to find companies that have recently seen positive earnings estimate revision activity. The idea is that more recent information is, generally speaking, more accurate and can be a better predictor of the future, which can give investors an advantage in earnings season.
The technique has proven to be very useful for finding positive surprises. In fact, when combining a Zacks Rank #3 or better and a positive Earnings ESP, stocks produced a positive surprise 70% of the time, while they also saw 28.3% annual returns on average, according to our 10 year backtest.
Howmet Aerospace serves aerospace and transportation markets through engine products, fastening systems, engineered structures and forged wheels. Its defense-aerospace exposure, engine-product capacity expansions and completed acquisitions/divestitures should support broader scale. Management expects full-year revenue, adjusted EBITDA and adjusted EPS to rise versus 2025, with free-cash-flow conversion around 90%, giving the defense-linked portfolio added financial flexibility over time and resilience ahead.
Potential Risks
Risks include unfavorable market shifts, tariffs, energy costs, supply-chain disruptions, customer losses, manufacturing issues, inability to meet demand, geopolitical tensions and government-contracting compliance failures.
Forecast
A Zacks Rank #2 is supportive, and B Growth is the standout Style Score, but F Value and C Momentum reflect a crowded, expensive trade. The chart remains compelling: price follows a strong uptrend, 2026–2028 consensus estimates keep rising, and frequent positive surprises show analysts have repeatedly underestimated margin leverage.
The Zacks Rank is a proprietary stock-rating model that uses trends in earnings estimate revisions and earnings-per-share (EPS) surprises to classify stocks into five groups: #1 (Strong Buy), #2 (Buy), #3 (Hold), #4 (Sell) and #5 (Strong Sell). The Zacks Rank is calculated through four primary factors related to earnings estimates: analysts' consensus on earnings estimate revisions, the magnitude of revision change, the upside potential and estimate surprise (or the degree in which earnings per share deviated from the previous quarter).
Zacks builds the data from 3,000 analysts at over 150 different brokerage firms. The average yearly gain for Zacks Rank #1 (Strong Buy) stocks is +24.00% per year from January 1, 1988, through May 4, 2026.
Selections for Best Defense Stocks are based on the current top ranking stocks on Zacks Indicator Score, Style Scores and fundamentals. All stocks have a daily trading volume of at least 100,000 shares and has a stock price of at least $5. All information is current as of market open, June 17, 2026.
General questions about defense stocks
What are defense stocks?
Defense stocks are shares of companies that develop, manufacture, and maintain military equipment, weapons systems, aircraft, cybersecurity solutions, and space infrastructure. Many balance government contracts with commercial operations.
What are the benefits of investing in defense stocks?
Long government contract visibility: Multi-year deals provide predictable revenue.
High barriers to entry: Regulatory and technical requirements limit competition.
Dividend potential: Some established contractors pay steady dividends.
Strategic importance: Defense spending tends to continue even during economic slowdowns.
Why do defense stocks go up during wars or conflicts?
Periods of heightened conflict often signal future increases in military procurement, which can lead to higher demand for weapons systems, logistics support, and modernization programs.
How does government spending affect defense stocks?
Defense budgets are a primary revenue driver. In the U.S., annual appropriations well above $800 billion in recent years support sustained demand for existing and next-generation systems.
Contract awards, budget extensions, and supplemental funding directly add to order backlogs.
Are defense stocks recession-proof?
Defense equities are often considered defensive because government contracts are less sensitive to consumer demand cycles. During downturns, primes like Lockheed Martin and General Dynamics have often shown smaller drawdowns than highly cyclical groups, benefiting from ongoing military spending. However, they are still equities and can decline during broad market downturns.
Which defense stocks perform best during inflation?
Companies with strong pricing power or contracts with cost-inflation adjustments tend to weather inflation better. Digital solutions, avionics, and advanced systems providers often have more margin resilience than heavy industrial manufacturers.
Can defense stocks be held forever?
Some investors hold major primes indefinitely due to stable cash flows and dividends. However, long-term technological shifts and defense policy priorities should prompt periodic portfolio review.
Are defense stocks ethical investments?
Opinions vary. Some investors avoid defense due to ESG concerns, while others view national security as a necessary public good. Investment suitability depends on personal values.
Defense stocks: Comparative and Risk Evaluation
Defense stocks vs. defense ETFs: Which is better?
Individual stocks offer company-specific upside but carry higher singular risk. Defense-oriented ETFs like the iShares U.S. Aerospace & Defense ETF (ITA) or SPDR S&P Aerospace & Defense ETF (XAR) provide diversified exposure across contractors.
Are defense stocks risky?
Key risks include:
Budget cuts or changes in procurement priorities.
Delays or cancellations of major programs.
Export restrictions and geopolitical policy shifts.
Smaller or niche players often experience greater volatility than large primes.
How dependent are defense companies on government contracts?
Many defense firms derive a significant portion of revenue from government orders. Primes like Lockheed Martin or Northrop Grumman often see more than half of their revenues tied to defense budgets.
Emerging companies like Intuitive Machines also work with NASA and the Department of Defense for space and communications services.
Do defense stocks do well in bear markets?
Defense names sometimes outperform more cyclical sectors because their sales are backed by government spending. But they still may decline in broad market selloffs.
Should defense stocks be part of a diversified portfolio?
Including defense stocks can add diversification benefits — particularly exposure to government-linked revenue streams — but concentration risk should be managed with balance across other industries.
Defense stocks strategies and portfolio
How to select defense stocks
Consider:
Contract backlog and visibility.
Balance-sheet health.
Dividend track record and payout ratio.
Exposure to next-generation technologies (hypersonics, AI, space).
International sales mix.
Which defense stocks perform best during inflation?
Look for firms with adaptable pricing terms in contracts and strong margins, such as avionics and systems integrators.
When should I sell defense stocks?
Consider selling when:
Valuations become extended relative to fundamentals.
Major programs are canceled or reduced.
Strategic focus shifts away from core growth areas.
Can defense stocks be held forever?
Long-term holding can make sense for stable, dividend-paying defense giants, but technological disruption and budget evolutions necessitate regular reassessment.
Defense stocks alternatives
If you want exposure to security themes without individual defense equities, alternatives include:
Broad industrial or technology ETFs with defense allocations.
International aerospace firms.
Cybersecurity companies supporting military and government networks.
Space infrastructure players like Intuitive Machines, which bridge commercial exploration and national security roles.
Bottom line
The best defense stocks combine government-linked demand with innovation and balance-sheet strength. Large primes like Lockheed Martin, RTX, Northrop Grumman, and General Dynamics anchor many portfolios, while emerging space-defense companies such as Intuitive Machines offer higher growth potential.
Balancing diversification, valuation discipline, and strategic themes — from traditional weapons systems to space-enabled defense infrastructure — can help investors navigate this complex sector.


 Strong Buy