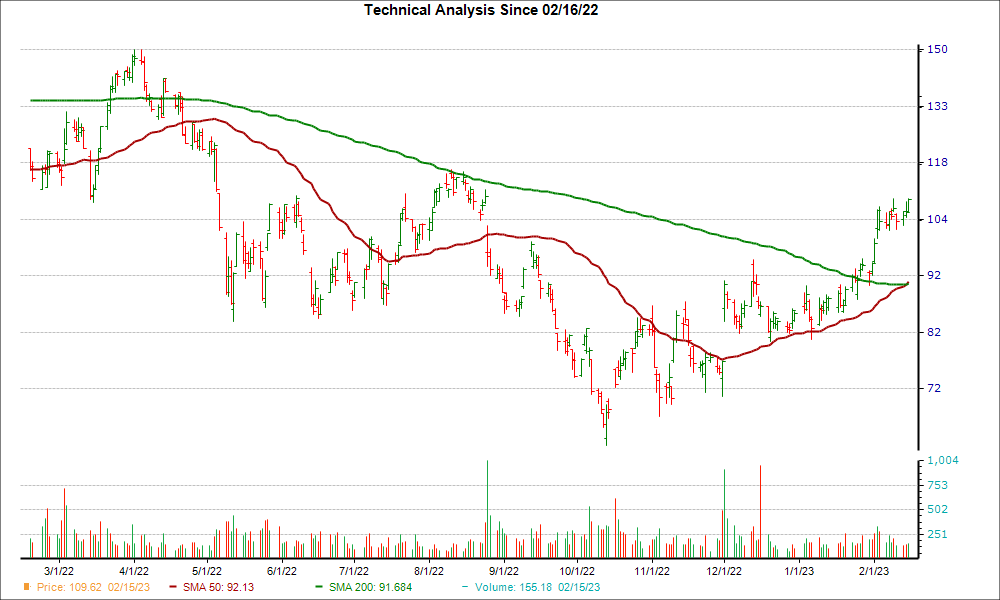
Splunk Inc. reached a significant support level, and could be a good pick for investors from a technical perspective. Recently, SPLK's 50-day simple moving average broke out above its 200-day moving average; this is known as a "golden cross."
There's a reason traders love a golden cross -- it's a technical chart pattern that can indicate a bullish breakout is on the horizon. This kind of crossover is formed when a stock's short-term moving average breaks above a longer-term moving average. Typically, a golden cross involves the 50-day and the 200-day moving averages, since bigger time periods tend to form stronger breakouts.
Golden crosses have three key stages that investors look out for. It starts with a downtrend in a stock's price that eventually bottoms out, followed by the stock's shorter moving average crossing over its longer moving average and triggering a trend reversal. The final stage is when a stock continues the upward climb to higher prices.
A golden cross is the opposite of a death cross, another technical event that indicates bearish price movement may be on the horizon.
Over the past four weeks, SPLK has gained 25.1%. The company currently sits at a #2 (Buy) on the Zacks Rank, also indicating that the stock could be poised for a breakout.
The bullish case solidifies once investors consider SPLK's positive earnings outlook. For the current quarter, no earnings estimate has been cut compared to 1 revisions higher in the past 60 days. The Zacks Consensus Estimate has increased too.
Investors should think about putting SPLK on their watchlist given the ultra-important technical indicator and positive move in earnings estimates.



 View the Zacks #1 Rank List

Image: Bigstock
Splunk (SPLK) Just Flashed Golden Cross Signal: Do You Buy?
Splunk Inc. reached a significant support level, and could be a good pick for investors from a technical perspective. Recently, SPLK's 50-day simple moving average broke out above its 200-day moving average; this is known as a "golden cross."
There's a reason traders love a golden cross -- it's a technical chart pattern that can indicate a bullish breakout is on the horizon. This kind of crossover is formed when a stock's short-term moving average breaks above a longer-term moving average. Typically, a golden cross involves the 50-day and the 200-day moving averages, since bigger time periods tend to form stronger breakouts.
Golden crosses have three key stages that investors look out for. It starts with a downtrend in a stock's price that eventually bottoms out, followed by the stock's shorter moving average crossing over its longer moving average and triggering a trend reversal. The final stage is when a stock continues the upward climb to higher prices.
A golden cross is the opposite of a death cross, another technical event that indicates bearish price movement may be on the horizon.
Over the past four weeks, SPLK has gained 25.1%. The company currently sits at a #2 (Buy) on the Zacks Rank, also indicating that the stock could be poised for a breakout.
The bullish case solidifies once investors consider SPLK's positive earnings outlook. For the current quarter, no earnings estimate has been cut compared to 1 revisions higher in the past 60 days. The Zacks Consensus Estimate has increased too.
Investors should think about putting SPLK on their watchlist given the ultra-important technical indicator and positive move in earnings estimates.