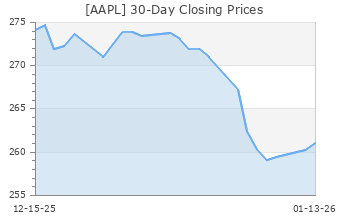
Apple (AAPL)
(Real Time Quote from BATS)
$172.29 USD
+1.96 (1.15%)
Updated May 1, 2024 02:46 PM ET
3-Hold of 5 3
D Value A Growth F Momentum C VGM
Company Summary
Apple’s business primarily runs around its flagship iPhone. However, the Services portfolio that includes revenues from cloud services, App store, Apple Music, AppleCare, Apple Pay, and licensing and other services now became the cash cow.
Moreover, non-iPhone devices like Apple Watch and AirPod gained significant traction. In fact, Apple dominates the Wearables and Hearables markets due to the growing adoption of Watch and AirPods. Solid uptake of Apple Watch also helped Apple strengthen its presence in the personal health monitoring space.
Apple is expanding non-iPhone portfolio with the launch of ...
Company Summary
Apple’s business primarily runs around its flagship iPhone. However, the Services portfolio that includes revenues from cloud services, App store, Apple Music, AppleCare, Apple Pay, and licensing and other services now became the cash cow.
Moreover, non-iPhone devices like Apple Watch and AirPod gained significant traction. In fact, Apple dominates the Wearables and Hearables markets due to the growing adoption of Watch and AirPods. Solid uptake of Apple Watch also helped Apple strengthen its presence in the personal health monitoring space.
Apple is expanding non-iPhone portfolio with the launch of Apple Vision Pro a spatial computer that blends digital content with the physical world.
Headquartered in Cupertino, CA, Apple also designs, manufactures and sells iPad, MacBookand HomePod. These devices are powered by software applications including iOS, macOS, watchOS and tvOS operating systems.
Apple’s other services include subscription-based Apple News+, Apple Card, Apple Arcade, new Apple TV app, Apple TV channels and Apple TV+, a new subscription service.
In fiscal 2023, Apple generated $383.29 billion in total revenues. The company’s flagship device iPhone accounted for 52.3% of total revenues. Services, Mac and iPad category contributed 22.2%, 7.7% and 7.4%, respectively. Wearables, Home and Accessories products category contributed 10.4%.
Apple primarily reports revenues on a geographic basis, namely the Americas (North & South America), Europe (European countries, India, Middle East and Africa), Greater China (China, Hong Kong & Taiwan), Japan and Rest of Asia Pacific (Australia & other Asian Countries).
In fiscal 2023, Americas, Europe, Greater China, Japan and Rest of Asia-Pacific accounted for 42.4%, 24.6%, 18.9%, 6.3% and 7.7% of total revenues, respectively.
Apple faces stiff competition from the likes of Samsung, Xiaomi, Oppo, Vivo, Google, Huawei and Motorola in the smartphone market. Lenovo, HP, Dell, Acer and Asus are its primary competitors in the PC market. Other notable competitors are Google & Amazon (smart speakers) and Fitbit & Xiaomi (wearables).
General Information
Apple Inc
ONE APPLE PARK WAY
CUPERTINO, CA 95014
Phone: 408-996-1010
Fax: 408-974-2483
Web: http://www.apple.com
Email: scasey@apple.com
| Industry | Computer - Mini computers |
| Sector | Computer and Technology |
| Fiscal Year End | September |
| Last Reported Quarter | 3/31/2024 |
| Earnings Date | 5/2/2024 |
EPS Information
| Current Quarter EPS Consensus Estimate | 1.51 |
| Current Year EPS Consensus Estimate | 6.53 |
| Estimated Long-Term EPS Growth Rate | 12.70 |
| Earnings Date | 5/2/2024 |
Price and Volume Information
| Zacks Rank | |
| Yesterday's Close | 170.33 |
| 52 Week High | 199.62 |
| 52 Week Low | 164.08 |
| Beta | 1.26 |
| 20 Day Moving Average | 57,532,584.00 |
| Target Price Consensus | 204.53 |

| 4 Week | 0.88 |
| 12 Week | -10.02 |
| YTD | -11.53 |
| 4 Week | 4.29 |
| 12 Week | -11.48 |
| YTD | -16.20 |
| Shares Outstanding (millions) | 15,441.88 |
| Market Capitalization (millions) | 2,630,215.50 |
| Short Ratio | NA |
| Last Split Date | 8/31/2020 |
| Dividend Yield | 0.56% |
| Annual Dividend | $0.96 |
| Payout Ratio | 0.15 |
| Change in Payout Ratio | -0.04 |
| Last Dividend Payout / Amount | 2/9/2024 / $0.24 |
Fundamental Ratios
| P/E (F1) | 26.07 |
| Trailing 12 Months | 26.53 |
| PEG Ratio | 2.06 |
| vs. Previous Year | 15.96% |
| vs. Previous Quarter | 49.32% |
| vs. Previous Year | 2.07% |
| vs. Previous Quarter | 33.61% |
| Price/Book | 35.49 |
| Price/Cash Flow | 24.41 |
| Price / Sales | 6.82 |
| 3/31/24 | NA |
| 12/31/23 | 156.04 |
| 9/30/23 | 160.78 |
| 3/31/24 | NA |
| 12/31/23 | 29.39 |
| 9/30/23 | 28.39 |
| 3/31/24 | NA |
| 12/31/23 | 1.07 |
| 9/30/23 | 0.99 |
| 3/31/24 | NA |
| 12/31/23 | 1.02 |
| 9/30/23 | 0.94 |
| 3/31/24 | NA |
| 12/31/23 | 26.16 |
| 9/30/23 | 25.31 |
| 3/31/24 | NA |
| 12/31/23 | 26.16 |
| 9/30/23 | 25.31 |
| 3/31/24 | NA |
| 12/31/23 | 30.71 |
| 9/30/23 | 29.67 |
| 3/31/24 | NA |
| 12/31/23 | 4.80 |
| 9/30/23 | 4.00 |
| 3/31/24 | NA |
| 12/31/23 | 30.65 |
| 9/30/23 | 30.61 |
| 3/31/24 | NA |
| 12/31/23 | 1.28 |
| 9/30/23 | 1.53 |
| 3/31/24 | NA |
| 12/31/23 | 56.20 |
| 9/30/23 | 60.52 |

