Advanced Micro Devices (AMD)
(Delayed Data from NSDQ)
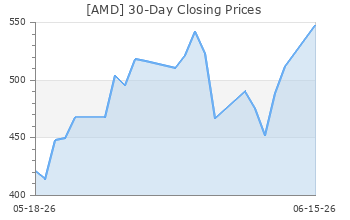
$158.32 USD
+1.57 (1.00%)
Updated Sep 24, 2024 04:00 PM ET
After-Market: $158.58 +0.26 (0.16%) 7:58 PM ET
3-Hold of 5 3
F Value D Growth F Momentum F VGM
Company Summary
Advanced Micro Devices has strengthened its position in the semiconductor market on the back of its evolution as an enterprise-focus company from a pure-bred consumer-PC chip provider. AMD has emerged as a strong challenger to NVIDIA's dominance in the graphic processing unit or GPU market based on its Radeon chips.
In consumer-PC market, AMD has become a key challenger to Intel courtesy AMD Ryzen desktop processor family. The company's desktop-based processor offerings include Ryzen and high-end Ryzen Threadripper processors, among others. AMD Athlon and AMD PRO series of processors cater to commercial ...
Company Summary
Advanced Micro Devices has strengthened its position in the semiconductor market on the back of its evolution as an enterprise-focus company from a pure-bred consumer-PC chip provider. AMD has emerged as a strong challenger to NVIDIA's dominance in the graphic processing unit or GPU market based on its Radeon chips.
In consumer-PC market, AMD has become a key challenger to Intel courtesy AMD Ryzen desktop processor family. The company's desktop-based processor offerings include Ryzen and high-end Ryzen Threadripper processors, among others. AMD Athlon and AMD PRO series of processors cater to commercial and consumer desktop PC market.
AMD's processors are primarily powered by the company's proprietary "Zen" CPU and "Vega" GPU architectures. The company’s acquisition of Xilinx has helped in expanding into multiple embedded markets. AMD now offers Field Programmable Gate Arrays (FPGAs), Adaptive SoCs, and Adaptive Compute Acceleration Platform (ACAP) products. Pensando buyout expanded AMD’s footprint into the data center market, where it now offers high-performance data processing units (DPUs) and a software stack.
Santa Clara, CA-based, AMD generated revenues of $22.68 billion in 2023. The company reports operations under four segments – Data Center, Client, Gaming, and Embedded.
The Data Center category primarily includes server CPUs and GPUs, DPUs, FPGAs, and adaptive SoC products for data centers. CPUs for server platforms currently include the AMD EPYC Series processors – AMD EPYC 9004 Series, AMD EPYC 7003 Series and AMD EPYC 7002 Series.
The Client segment primarily includes CPUs, APUs, and chipsets for desktop and notebook personal computers. CPUs for desktop platforms currently include the AMD Ryzen and AMD Athlon series processors.
The Gaming segment primarily includes discrete GPUs, semi-custom SoC products and development services.
The Embedded segment primarily includes embedded CPUs, GPUs, APUs, FPGAs and adaptive SoC products.
Data Center, Client, Gaming, and Embedded accounted for 28.6%, 20.5%, 27.4% and 23.5%, respectively.
General Information
Advanced Micro Devices, Inc
2485 AUGUSTINE DRIVE
SANTA CLARA, CA 95054
Phone: 408-749-4000
Fax: 408-982-6164
Web: http://www.amd.com
Email: investor.relations@amd.com
| Industry | Electronics - Semiconductors |
| Sector | Computer and Technology |
| Fiscal Year End | December |
| Last Reported Quarter | 6/30/2024 |
| Exp Earnings Date | 10/29/2024 |
EPS Information
| Current Quarter EPS Consensus Estimate | 0.91 |
| Current Year EPS Consensus Estimate | 3.36 |
| Estimated Long-Term EPS Growth Rate | 28.60 |
| Exp Earnings Date | 10/29/2024 |
Price and Volume Information
| Zacks Rank | |
| Yesterday's Close | 156.75 |
| 52 Week High | 227.30 |
| 52 Week Low | 93.12 |
| Beta | 1.69 |
| 20 Day Moving Average | 32,069,196.00 |
| Target Price Consensus | 194.09 |
| 4 Week | 4.51 |
| 12 Week | -0.60 |
| YTD | 6.34 |
| 4 Week | 2.65 |
| 12 Week | -4.83 |
| YTD | -11.31 |
| Shares Outstanding (millions) | 1,618.48 |
| Market Capitalization (millions) | 253,697.03 |
| Short Ratio | NA |
| Last Split Date | 8/22/2000 |
| Dividend Yield | 0.00% |
| Annual Dividend | $0.00 |
| Payout Ratio | 0.00 |
| Change in Payout Ratio | 0.00 |
| Last Dividend Payout / Amount | NA / $0.00 |
Fundamental Ratios
| P/E (F1) | 46.68 |
| Trailing 12 Months | 56.38 |
| PEG Ratio | 1.63 |
| vs. Previous Year | 25.00% |
| vs. Previous Quarter | 16.28% |
| vs. Previous Year | 8.88% |
| vs. Previous Quarter | 6.61% |
| Price/Book | 4.49 |
| Price/Cash Flow | 37.34 |
| Price / Sales | 10.90 |
| 6/30/24 | 5.98 |
| 3/31/24 | 5.72 |
| 12/31/23 | 5.73 |
| 6/30/24 | 4.93 |
| 3/31/24 | 4.68 |
| 12/31/23 | 4.66 |
| 6/30/24 | 2.82 |
| 3/31/24 | 2.64 |
| 12/31/23 | 2.51 |
| 6/30/24 | 2.01 |
| 3/31/24 | 1.92 |
| 12/31/23 | 1.86 |
| 6/30/24 | 14.36 |
| 3/31/24 | 13.92 |
| 12/31/23 | 13.94 |
| 6/30/24 | 5.82 |
| 3/31/24 | 4.89 |
| 12/31/23 | 3.77 |
| 6/30/24 | 4.23 |
| 3/31/24 | 3.00 |
| 12/31/23 | 2.17 |
| 6/30/24 | 34.93 |
| 3/31/24 | 34.77 |
| 12/31/23 | 34.59 |
| 6/30/24 | 2.65 |
| 3/31/24 | 2.70 |
| 12/31/23 | 2.78 |
| 6/30/24 | 0.03 |
| 3/31/24 | 0.03 |
| 12/31/23 | 0.03 |
| 6/30/24 | 2.95 |
| 3/31/24 | 2.97 |
| 12/31/23 | 2.98 |