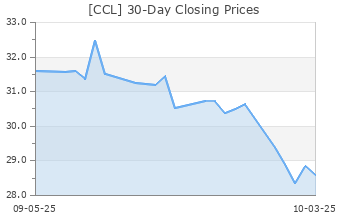
Carnival (CCL)
(Real Time Quote from BATS)
$14.60 USD
+0.04 (0.28%)
Updated May 14, 2024 01:29 PM ET
3-Hold of 5 3
A Value A Growth A Momentum A VGM
Company Summary
Founded in 1972 and headquartered in Miami, FL, Carnival operates as a cruise and vacation company. As a single economic entity, Carnival Corporation & Carnival plc forms the largest cruise operator in the world. It is the world’s leading leisure travel firm and carries nearly half of the global cruise guests. The company operates in North America, Australia, Europe and Asia.
The firm’s cruise brand include AIDA Cruises, Carnival Cruise Line, Costa Cruises, Cunard, Holland America Line, Princess Cruises, P&O Cruises (Australia), P&O Cruises (UK) and Seabourn. ...
Company Summary
Founded in 1972 and headquartered in Miami, FL, Carnival operates as a cruise and vacation company. As a single economic entity, Carnival Corporation & Carnival plc forms the largest cruise operator in the world. It is the world’s leading leisure travel firm and carries nearly half of the global cruise guests. The company operates in North America, Australia, Europe and Asia.
The firm’s cruise brand include AIDA Cruises, Carnival Cruise Line, Costa Cruises, Cunard, Holland America Line, Princess Cruises, P&O Cruises (Australia), P&O Cruises (UK) and Seabourn. It is of the opinion that cruising provides a diverse array of products and services tailored to accommodate vacationing guests of various ages, backgrounds and interests.
Carnival has four reportable segments, namely, (1) NAA cruise operations, (2) EA cruise operations, (3) Cruise Support and (4) Tour and Other.
The company has grouped the operating segments within its NAA and EA reportable segments by combining them according to the similarity of their economic and other characteristics. The Cruise Support segment encompasses a range of services, including a portfolio of top port destinations, all operated for the benefit of the company's cruise brands. Meanwhile, the Tour and Other segment comprises the hotel and transportation operations of Holland America Princess Alaska Tours, along with other related activities.
Carnival Cruise Line is one of the most recognizable brands in the cruise industry and carried over 12.5 million guests in 2023. This comprised 8.6 million and 3.8 million guests taken by the NAA and EA segments, respectively.
General Information
Carnival Corporation
3655 N W 87TH AVE PO BOX 1347
MIAMI, FL 33178
Phone: 305-599-2600
Fax: 305-399-4696
Web: http://www.carnivalcorp.com
Email: NA
| Industry | Leisure and Recreation Services |
| Sector | Consumer Discretionary |
| Fiscal Year End | November |
| Last Reported Quarter | 2/29/2024 |
| Exp Earnings Date | 6/24/2024 |
EPS Information
| Current Quarter EPS Consensus Estimate | -0.01 |
| Current Year EPS Consensus Estimate | 1.02 |
| Estimated Long-Term EPS Growth Rate | NA |
| Exp Earnings Date | 6/24/2024 |
Price and Volume Information
| Zacks Rank | |
| Yesterday's Close | 14.56 |
| 52 Week High | 19.74 |
| 52 Week Low | 9.82 |
| Beta | 2.53 |
| 20 Day Moving Average | 24,528,270.00 |
| Target Price Consensus | 21.45 |

| 4 Week | 3.56 |
| 12 Week | -1.62 |
| YTD | -21.47 |
| 4 Week | 0.39 |
| 12 Week | -5.69 |
| YTD | -28.26 |
| Shares Outstanding (millions) | 1,122.32 |
| Market Capitalization (millions) | 16,340.99 |
| Short Ratio | NA |
| Last Split Date | 6/15/1998 |
| Dividend Yield | 0.00% |
| Annual Dividend | $0.00 |
| Payout Ratio | 0.00 |
| Change in Payout Ratio | NA |
| Last Dividend Payout / Amount | NA / $0.00 |
Fundamental Ratios
| P/E (F1) | 14.29 |
| Trailing 12 Months | 42.82 |
| PEG Ratio | NA |
| vs. Previous Year | 74.55% |
| vs. Previous Quarter | -100.00% |
| vs. Previous Year | 21.98% |
| vs. Previous Quarter | 0.17% |
| Price/Book | 2.45 |
| Price/Cash Flow | 6.44 |
| Price / Sales | 0.72 |
| 2/29/24 | 7.75 |
| 11/30/23 | 0.02 |
| 8/31/23 | -15.00 |
| 2/29/24 | 1.02 |
| 11/30/23 | 0.00 |
| 8/31/23 | -1.90 |
| 2/29/24 | 0.36 |
| 11/30/23 | 0.46 |
| 8/31/23 | 0.43 |
| 2/29/24 | 0.32 |
| 11/30/23 | 0.41 |
| 8/31/23 | 0.38 |
| 2/29/24 | 2.26 |
| 11/30/23 | 0.00 |
| 8/31/23 | -4.88 |
| 2/29/24 | 1.79 |
| 11/30/23 | -0.34 |
| 8/31/23 | -8.11 |
| 2/29/24 | 1.82 |
| 11/30/23 | -0.29 |
| 8/31/23 | -8.11 |
| 2/29/24 | 5.95 |
| 11/30/23 | 6.15 |
| 8/31/23 | 6.22 |
| 2/29/24 | 29.72 |
| 11/30/23 | 30.19 |
| 8/31/23 | 30.97 |
| 2/29/24 | 4.27 |
| 11/30/23 | 4.14 |
| 8/31/23 | 4.24 |
| 2/29/24 | 81.03 |
| 11/30/23 | 80.54 |
| 8/31/23 | 80.92 |

