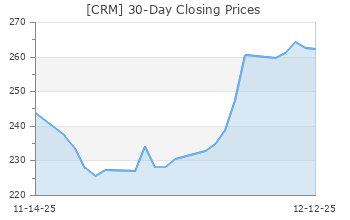
Salesforce (CRM)
(Delayed Data from NYSE)
$264.21 USD
-2.59 (-0.97%)
Updated Sep 23, 2024 04:00 PM ET
After-Market: $264.00 -0.21 (-0.08%) 7:58 PM ET
3-Hold of 5 3
C Value C Growth B Momentum C VGM
Company Summary
Salesforce is the leading provider of on-demand Customer Relationship Management (CRM) software, which enables organizations to better manage critical operations, such as sales force automation, customer service and support, marketing automation, document management, analytics and custom application development.
Headquartered in San Francisco, Salesforce, Inc. was founded in 1999. Over the course of two and a half decades, the company has established itself as the world's leading CRM vendor with a market share of nearly 20%, according to the reports of Gartner, a global research and advisory firm. Its nearest rival, SAP is way behind at ...
Company Summary
Salesforce is the leading provider of on-demand Customer Relationship Management (CRM) software, which enables organizations to better manage critical operations, such as sales force automation, customer service and support, marketing automation, document management, analytics and custom application development.
Headquartered in San Francisco, Salesforce, Inc. was founded in 1999. Over the course of two and a half decades, the company has established itself as the world's leading CRM vendor with a market share of nearly 20%, according to the reports of Gartner, a global research and advisory firm. Its nearest rival, SAP is way behind at a market share of around 8%. About 90% of the Fortune 100 companies uses at least one Salesforce software.
The company has leveraged its expertise in on-demand software to increase the scale of operations. It also offers a technology platform for customers and developers to build and run business applications.
Salesforce helps companies of every size and industry to connect with their customers in new ways through existing and emerging technologies including cloud, mobile, social, IoT and artificial intelligence (AI).
Rapid digital transformation and the company’s sustained focus on aligning products with customer needs are driving the top line. Salesforce’s annual revenues have sextupled from $5.4 billion in fiscal 2015 to $34.9 billion in fiscal 2024.
There are two main revenue streams — Subscription and Support and Professional Services & Other.
Subscription revenues comprise subscription fees from customers, accessing the company’s enterprise cloud computing services (Cloud Services), software licenses and subscription fees recognized from customers for additional support. This segment accounted for more than 93% of Salesforce’s fiscal 2024 revenues.
Professional Services & Other revenues consist of fees that the company derives from consulting and implementation services and training. This segment accounted for the remaining 7% of Salesforce’s fiscal 2024 revenues.
General Information
Salesforce Inc
415 MISSION STREET
SAN FRANCISCO, CA 94105
Phone: 415-901-7000
Fax: 415-901-7040
Web: http://www.salesforce.com
Email: investor@salesforce.com
| Industry | Computer - Software |
| Sector | Computer and Technology |
| Fiscal Year End | January |
| Last Reported Quarter | 7/31/2024 |
| Exp Earnings Date | 12/4/2024 |
EPS Information
| Current Quarter EPS Consensus Estimate | 2.43 |
| Current Year EPS Consensus Estimate | 10.07 |
| Estimated Long-Term EPS Growth Rate | 14.60 |
| Exp Earnings Date | 12/4/2024 |
Price and Volume Information
| Zacks Rank | |
| Yesterday's Close | 266.80 |
| 52 Week High | 318.72 |
| 52 Week Low | 193.68 |
| Beta | 1.29 |
| 20 Day Moving Average | 6,350,759.00 |
| Target Price Consensus | 305.61 |
| 4 Week | 1.06 |
| 12 Week | 3.77 |
| YTD | 1.39 |
| 4 Week | -0.14 |
| 12 Week | -0.63 |
| YTD | -15.19 |
| Shares Outstanding (millions) | 956.00 |
| Market Capitalization (millions) | 255,060.78 |
| Short Ratio | NA |
| Last Split Date | 4/18/2013 |
| Dividend Yield | 0.60% |
| Annual Dividend | $1.60 |
| Payout Ratio | 0.22 |
| Change in Payout Ratio | 0.21 |
| Last Dividend Payout / Amount | 9/18/2024 / $0.80 |
Fundamental Ratios
| P/E (F1) | 26.49 |
| Trailing 12 Months | 28.38 |
| PEG Ratio | 1.81 |
| vs. Previous Year | 17.79% |
| vs. Previous Quarter | 1.05% |
| vs. Previous Year | 8.39% |
| vs. Previous Quarter | 2.10% |
| Price/Book | 4.43 |
| Price/Cash Flow | 21.78 |
| Price / Sales | 6.99 |
| 7/31/24 | 12.01 |
| 4/30/24 | 11.57 |
| 1/31/24 | 10.42 |
| 7/31/24 | 7.45 |
| 4/30/24 | 7.18 |
| 1/31/24 | 6.45 |
| 7/31/24 | 1.04 |
| 4/30/24 | 1.11 |
| 1/31/24 | 1.09 |
| 7/31/24 | 1.04 |
| 4/30/24 | 1.11 |
| 1/31/24 | 1.09 |
| 7/31/24 | 19.36 |
| 4/30/24 | 19.05 |
| 1/31/24 | 17.43 |
| 7/31/24 | 15.44 |
| 4/30/24 | 15.30 |
| 1/31/24 | 11.87 |
| 7/31/24 | 18.75 |
| 4/30/24 | 18.16 |
| 1/31/24 | 14.20 |
| 7/31/24 | 60.29 |
| 4/30/24 | 61.59 |
| 1/31/24 | 61.62 |
| 7/31/24 | NA |
| 4/30/24 | NA |
| 1/31/24 | NA |
| 7/31/24 | 0.15 |
| 4/30/24 | 0.14 |
| 1/31/24 | 0.14 |
| 7/31/24 | 12.76 |
| 4/30/24 | 12.38 |
| 1/31/24 | 12.38 |